
Mistake Cost Analysis: What Your Mistake Tags Add Up To
Most traders know they make psychological mistakes. Fewer have ever added up the net P&L of the trades carrying those mistakes. That gap between knowing and measuring is where performance improvements get lost.
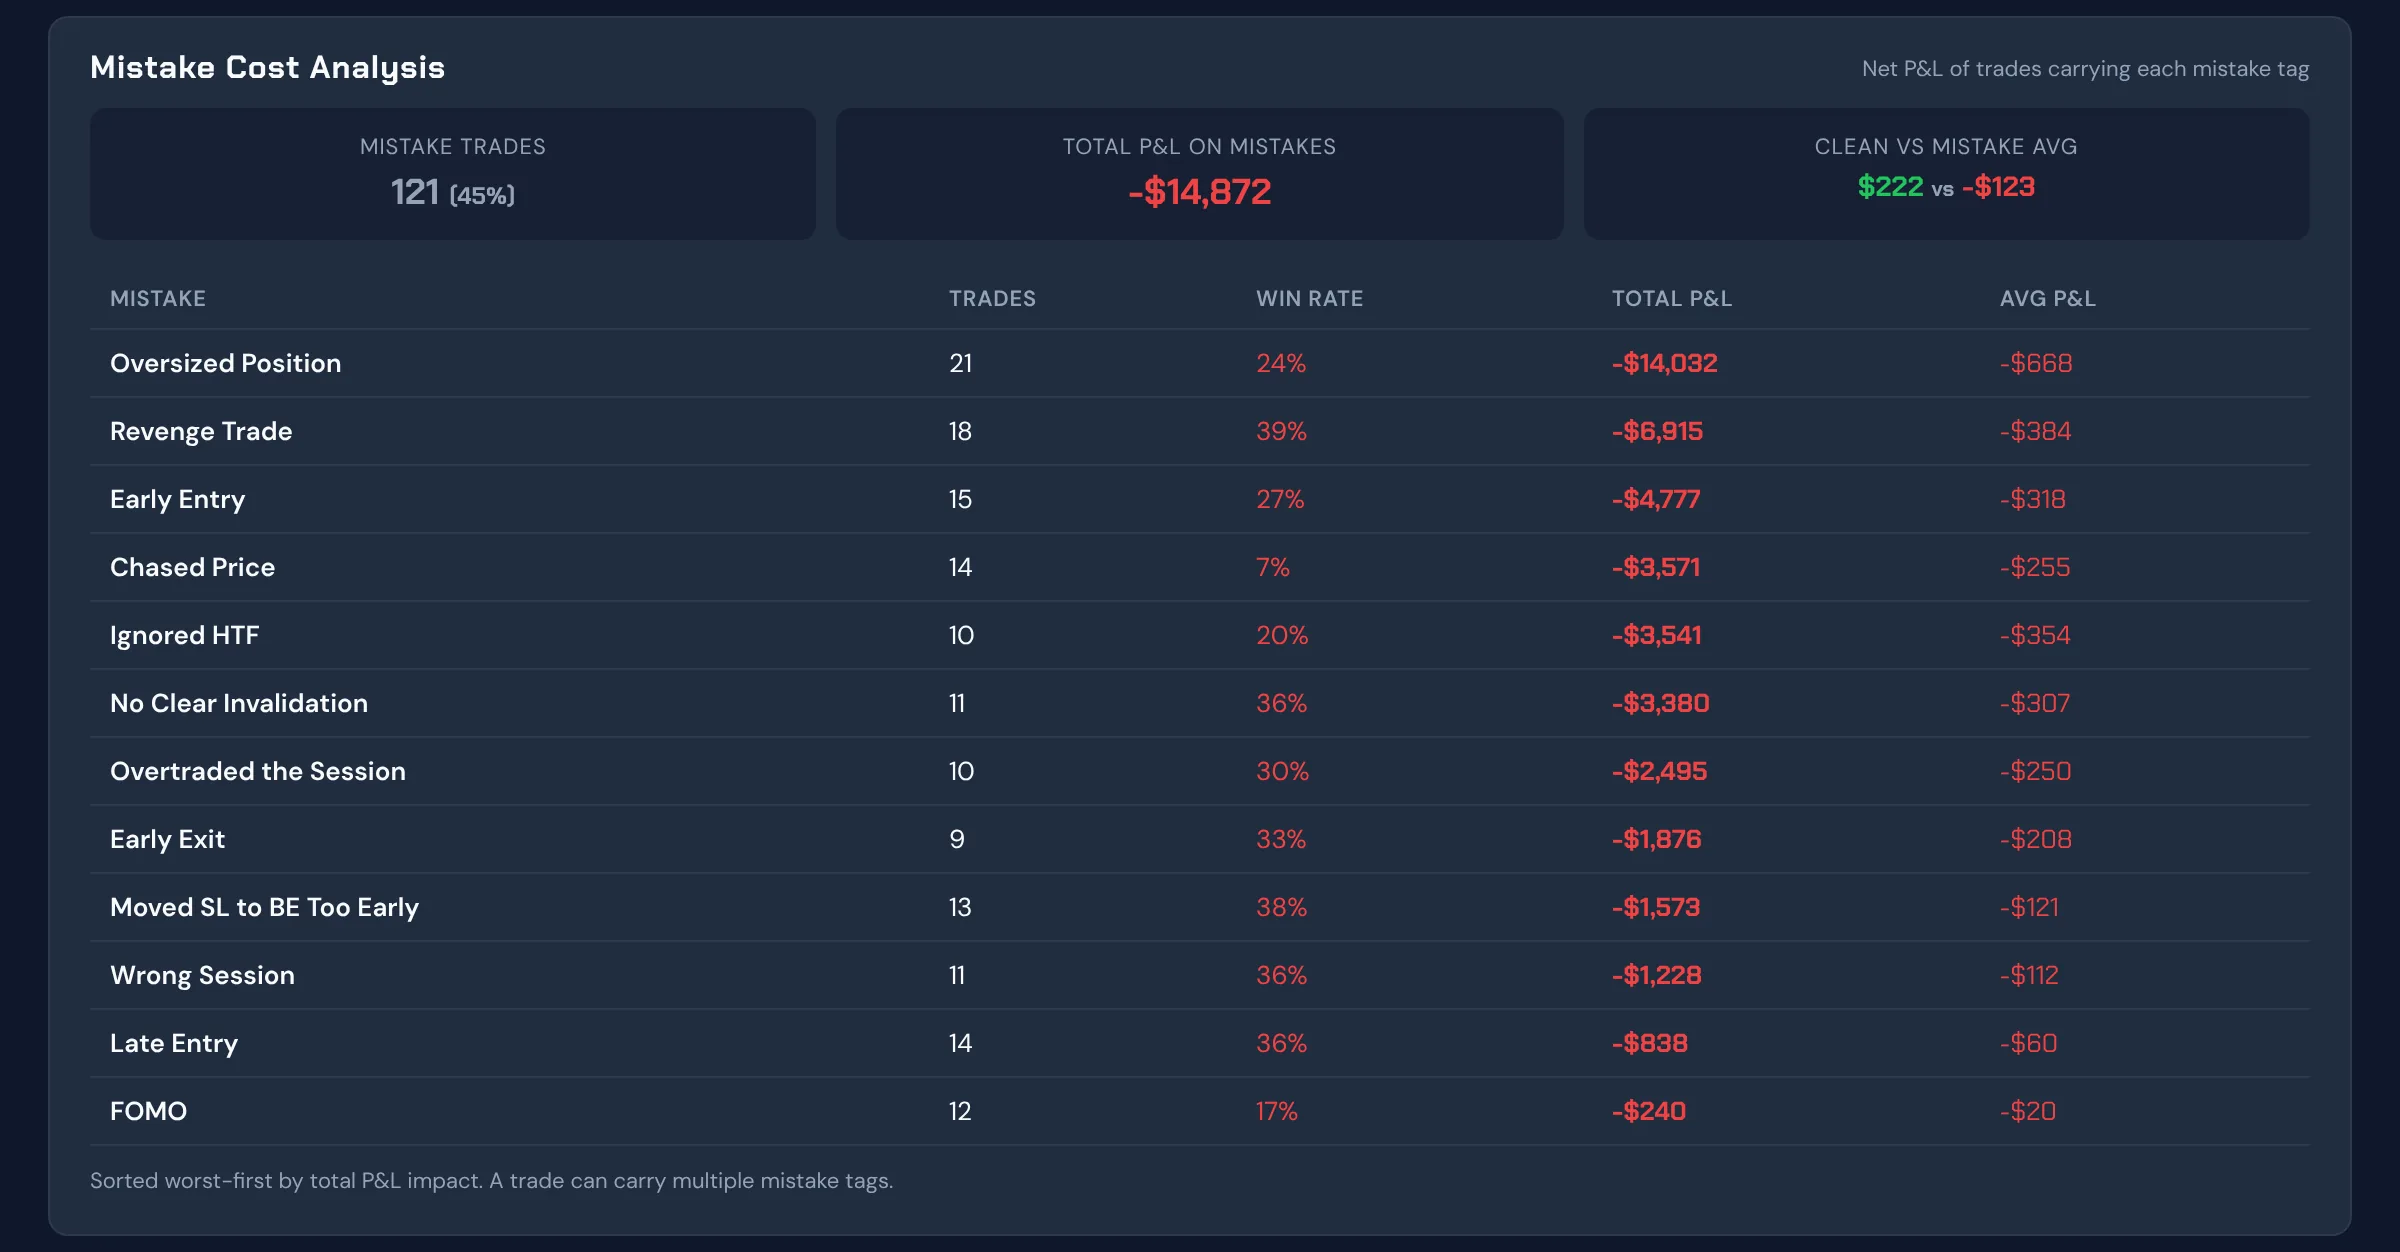
Mistake Cost Analysis is the practice of attaching a dollar (or R) value to every execution error, then ranking those mistakes by total cost. The result is a priority list — not a general note to "improve discipline", but a specific ranked list of which behaviours are destroying the most value.
Common Trading Mistakes to Track
The exact list depends on your trading style, but common categories include:
- Moving stop loss further away (letting a loss run)
- Taking profit too early (closing before target)
- Revenge trading (entering immediately after a loss)
- Oversizing (risking more than your plan allows)
- Trading outside your session or without a setup
- Chasing entry (entering after the move has already happened)
- Breaking daily loss rules
- Adding to a losing position
The key is to flag these honestly at the time of journaling, not retrospectively. A trade that made money despite a rule break is still a rule break.
How to Track Trading Mistakes
Knowing the list above is easy. Actually tagging every mistake, on every trade, consistently enough that the data means anything, is where most traders quit. Three things make it stick:
- Use a fixed set of tags, not free text. "Moved stop" written three different ways across three trades is three different mistakes to your analytics. Pick a short list once and reuse it.
- Tag at the time you close the trade, not later. Memory is generous to itself. A day later, "I moved my stop a bit" quietly becomes "the market just went against me." Log the mistake in the same sitting as the outcome.
- Allow more than one tag per trade. A single trade is often oversized and entered outside your session. If your journal only allows one mistake label, you lose half the data on your worst trades.
The Trading Terminal's trade form lets you select every mistake that applies from the same list you defined, on the same screen you log the trade — so tagging is a checkbox, not a separate habit you have to remember to keep up.
Calculating the Cost
The cost of a mistake on a single trade is the difference between what actually happened and what should have happened under your rules. Examples:
| Mistake | What Happened | Should Have Happened | Cost |
|---|---|---|---|
| Early exit | Closed at +0.4R | Target was +2R, hit later | −1.6R |
| Moved stop | Lost −3R | Stop was −1R | −2R |
| Oversized | Lost −$300 (3× plan) | Planned loss was −$100 | −$200 |
| Revenge trade | Lost −1R | No trade should have been taken | −1R |
When you aggregate these costs across all trades with that mistake label, you get the total cost of that behaviour over your sample period. That number is usually surprising.
What to Do With the Results
Once you have a ranked list, the approach is straightforward: fix the most expensive mistake first. Don't try to eliminate five bad habits simultaneously — that's how nothing improves. Pick the mistake tag with the lowest total net P&L and focus on it exclusively until the behaviour changes.
The psychological reality is that attaching a net P&L figure to a behaviour pattern is more concrete than a vague instruction to "stop revenge trading." When you can see that trades tagged with a specific mistake netted -$800 last month, the priority becomes concrete.
Track It in The Trading Terminal
The Trading Terminal's Mistake Cost Analysis feature does this automatically. As you log trades and flag mistakes, the system accumulates cost data by mistake type and presents it ranked by total impact — the largest cost at the top. On any account, including a prop firm account, the ranked list shows which mistake tags carry the lowest total net P&L.
Frequently Asked Questions
What is Mistake Cost Analysis?
It adds up the net P&L of every trade that carries each mistake tag and ranks the tags from the lowest total. It describes what the tagged trades produced; it does not estimate what those trades would have made without the mistake.
Which trading mistakes should I track?
Start with the habits you already suspect, such as moving a stop, entering early, chasing, overtrading, oversizing or revenge trading. Use a fixed list of tags so the same mistake always has the same name, and tag a trade with every mistake that applied.
Is Mistake Cost Analysis available on the free plan?
Tagging mistakes in the trade journal is free, but the Mistake Cost Analysis view is part of the Analytics page, which is on Pro and Elite. Free plan users can still count tagged trades in a spreadsheet using the free template.
Tagging mistakes works on the Free plan, which you can read about on the free trading journal page. Mistake Cost Analysis, which adds up each tag, is on Pro and Elite.
See your mistake tags ranked by the total net P&L of the trades carrying them.
Track Your Trades Free →