The trading journal that breaks down your P&L by setup, session, and mistake — so you can see exactly what's working and what's costing you.
A trading journal and analytics platform built for forex, crypto and indices traders
No card required
Free tier
$0 forever
Instruments
150+
Integrations
MT5 · cTrader
Data policy
Never sold
SYSTEM MODULES
10 tools. One terminal.
Everything a serious trader needs to journal, analyse, and manage risk — no spreadsheets, no five subscriptions.
JOURNAL + ANALYTICS
Log every trade. See what's actually working.
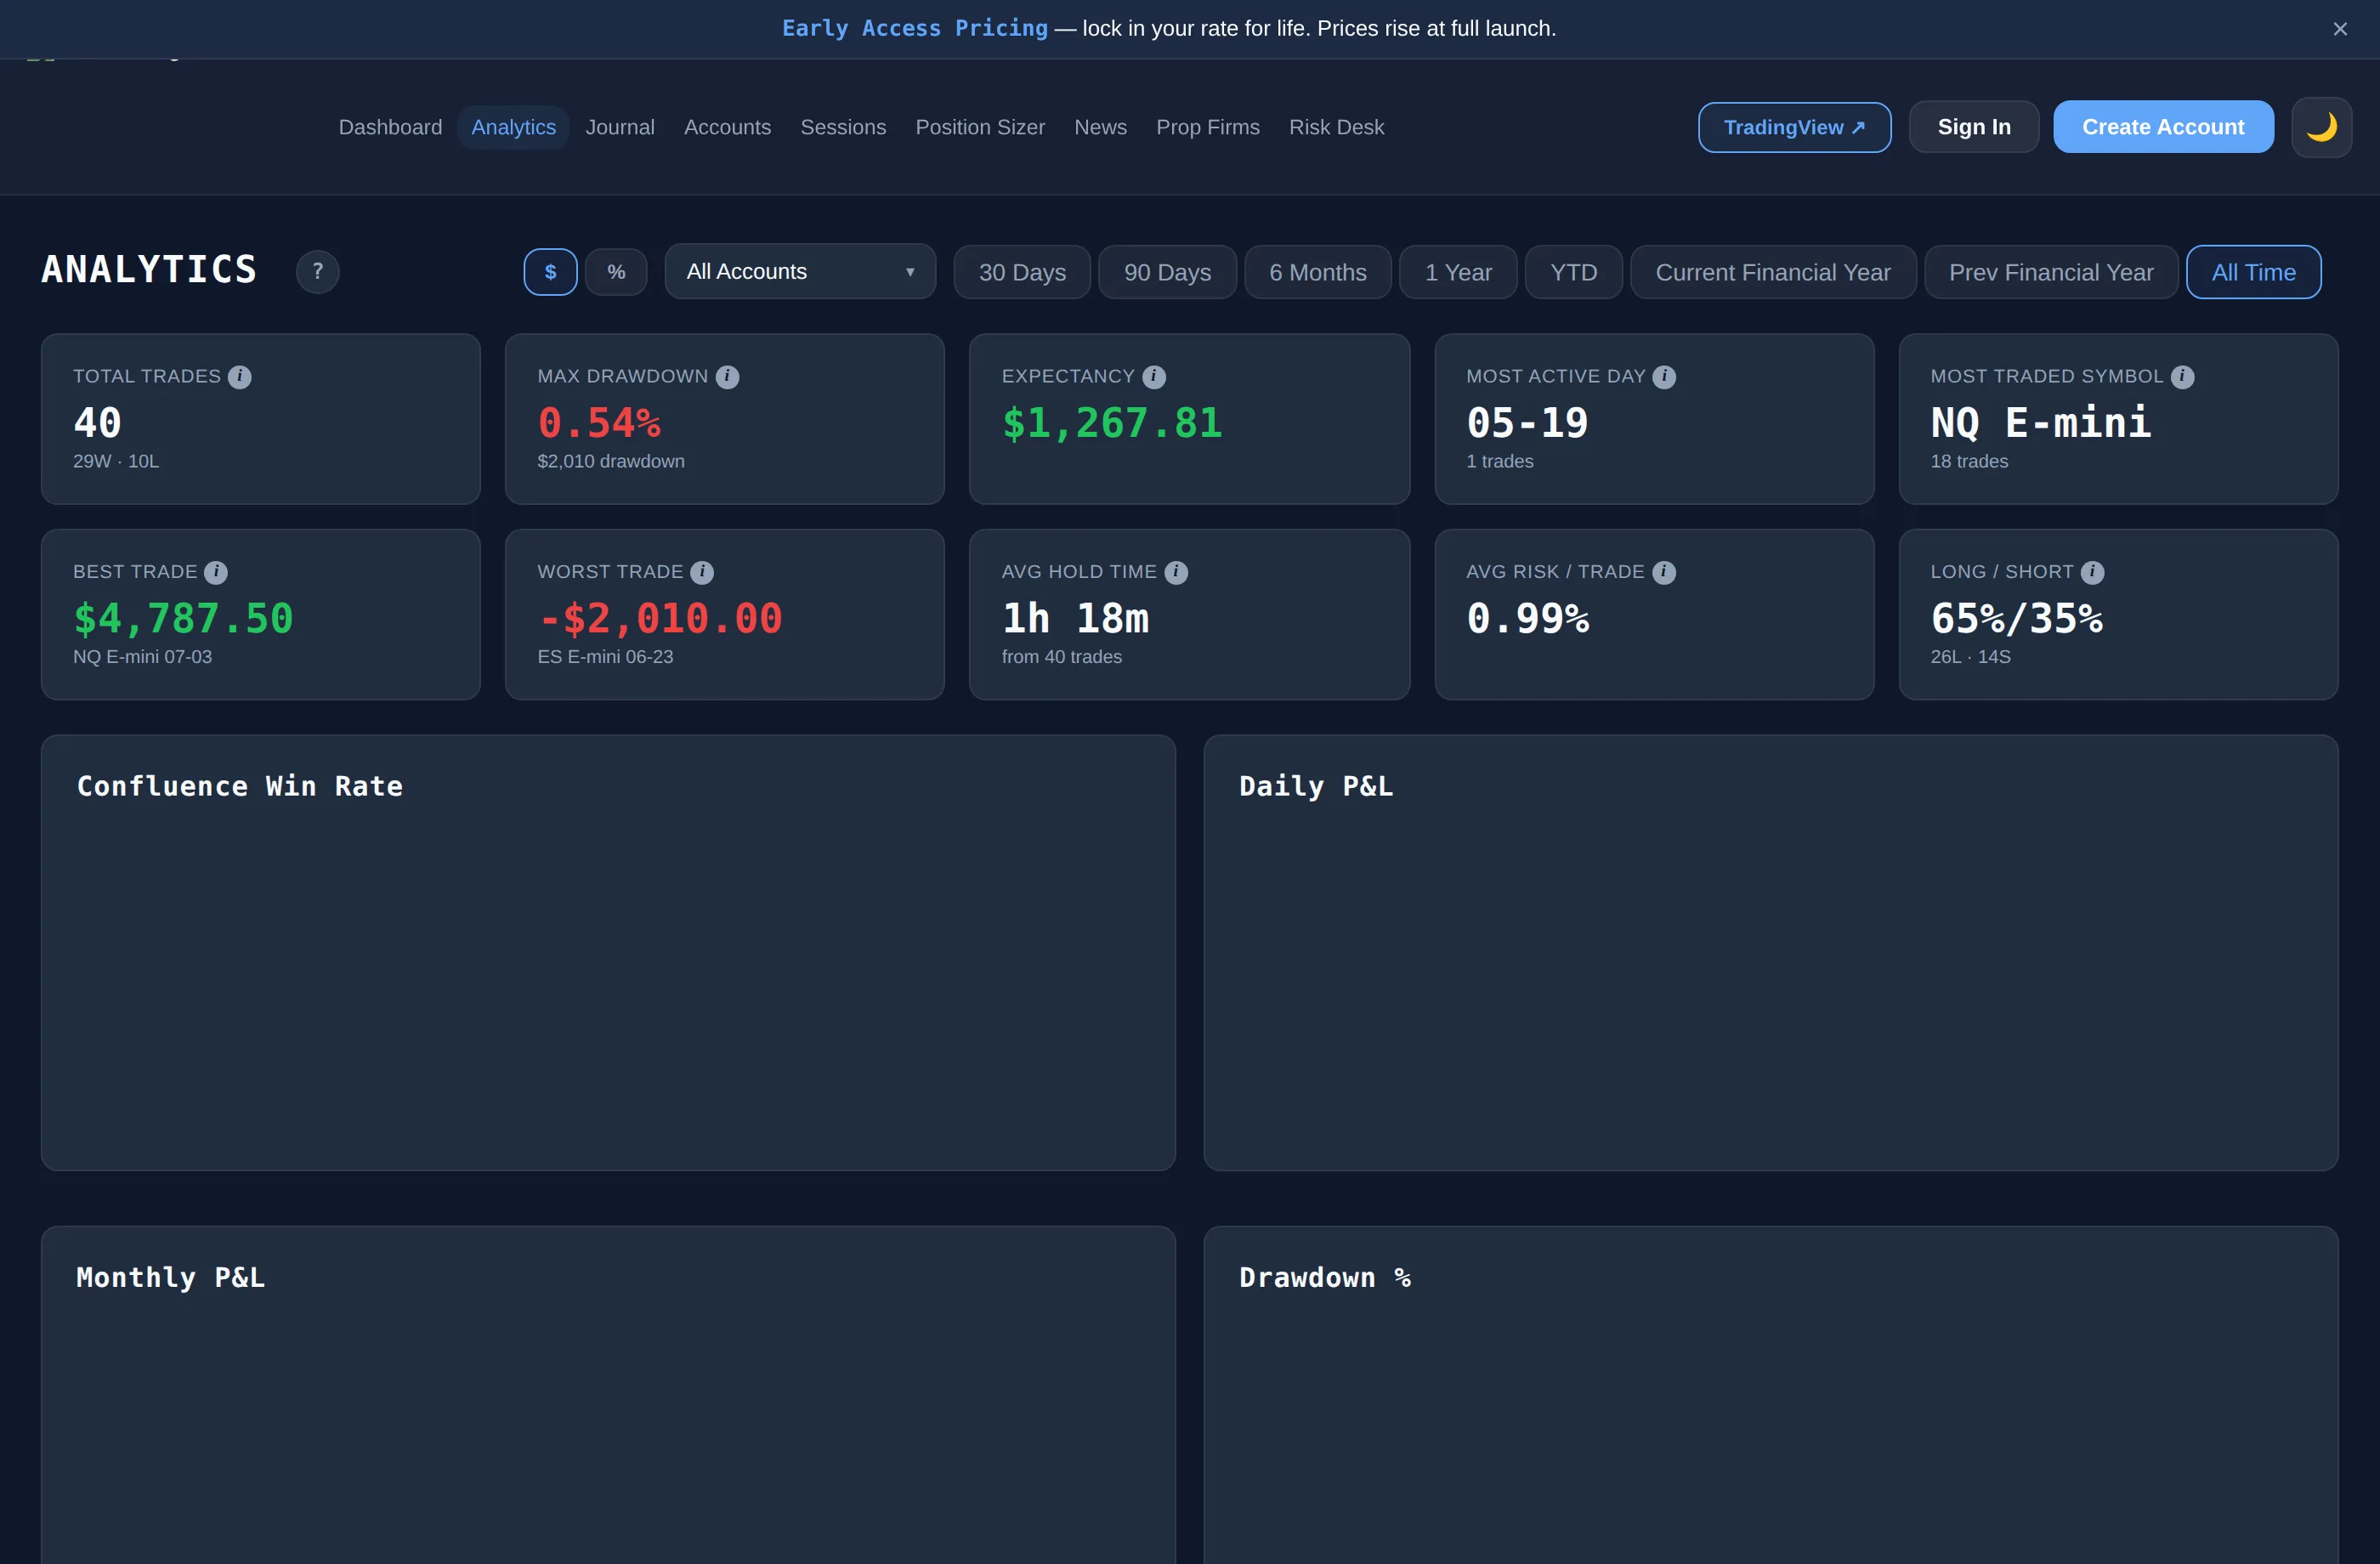
Entry/exit, R:R, setup tags, confluences, screenshots, emotion ratings. Pro analytics breaks it down by session, day, and setup — with Mistake Cost Analysis showing the dollar cost of every rule you break.
RISK DESK
Stops you before you blow an account.
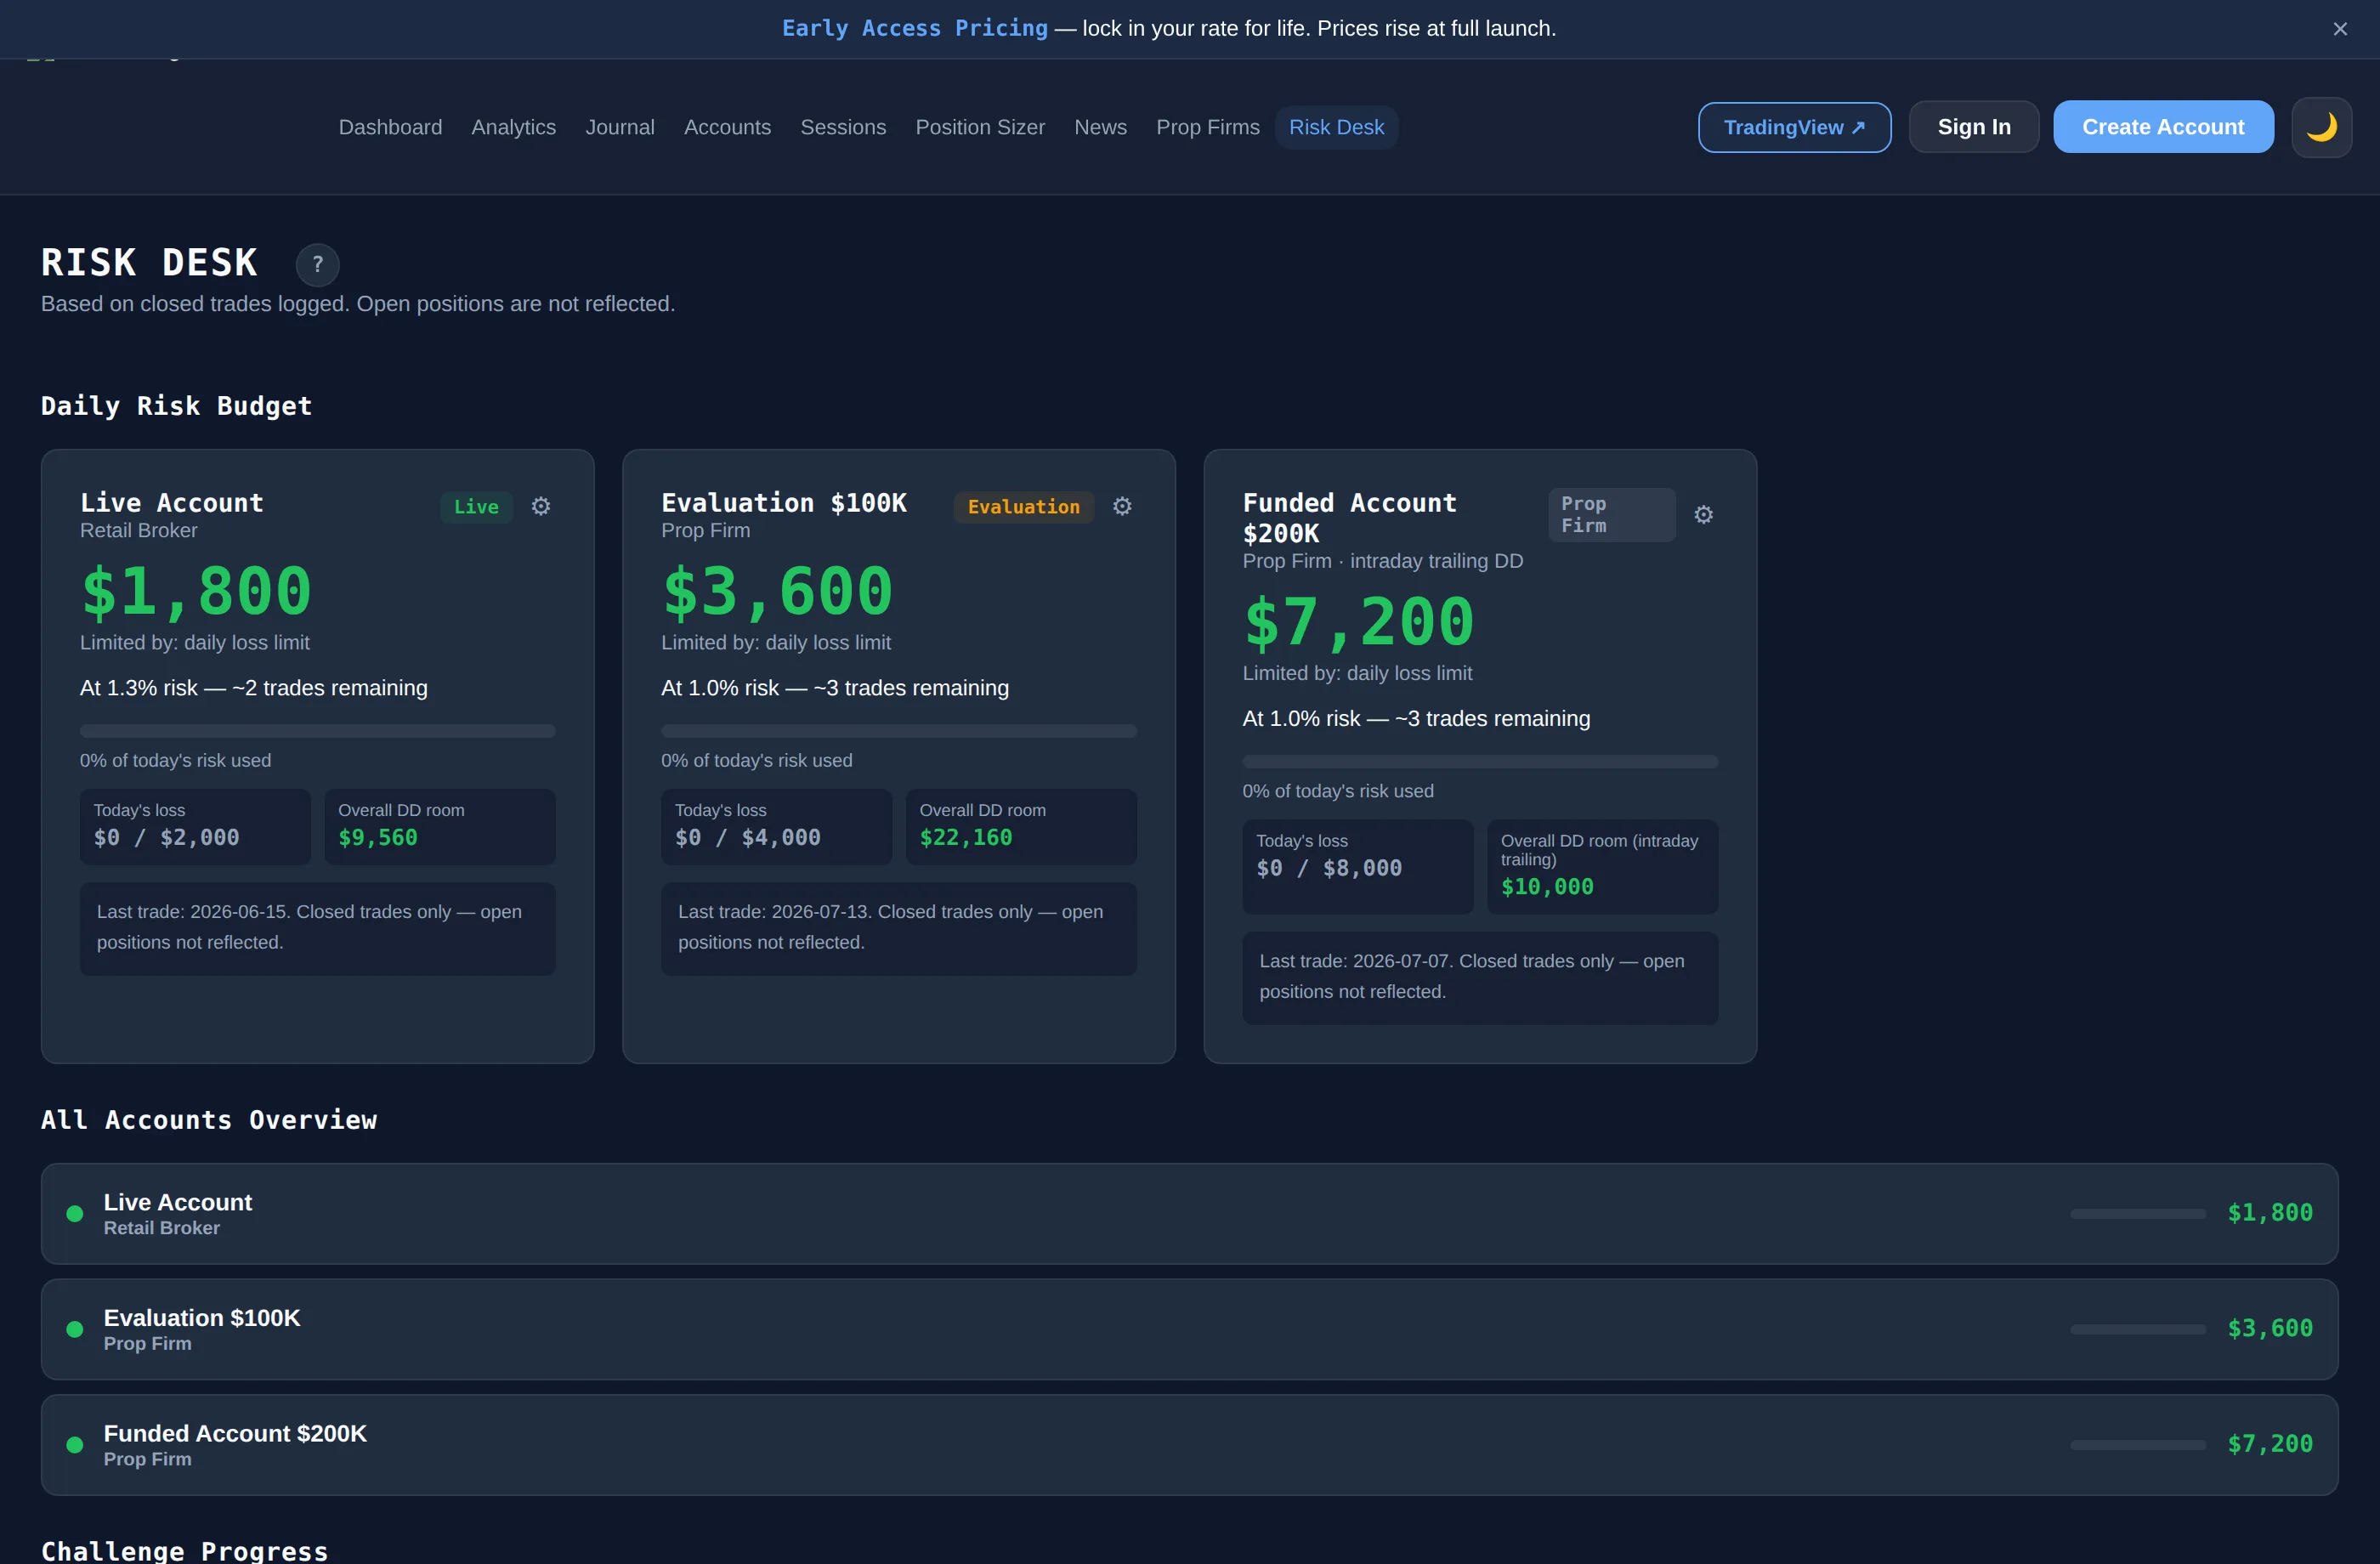
Daily risk budget with alerts at 70% and 90%. Trailing drawdown tracking. Multi-account challenge monitoring. Built for prop traders who can't afford a blown day.
DASHBOARD
Every stat. One screen.
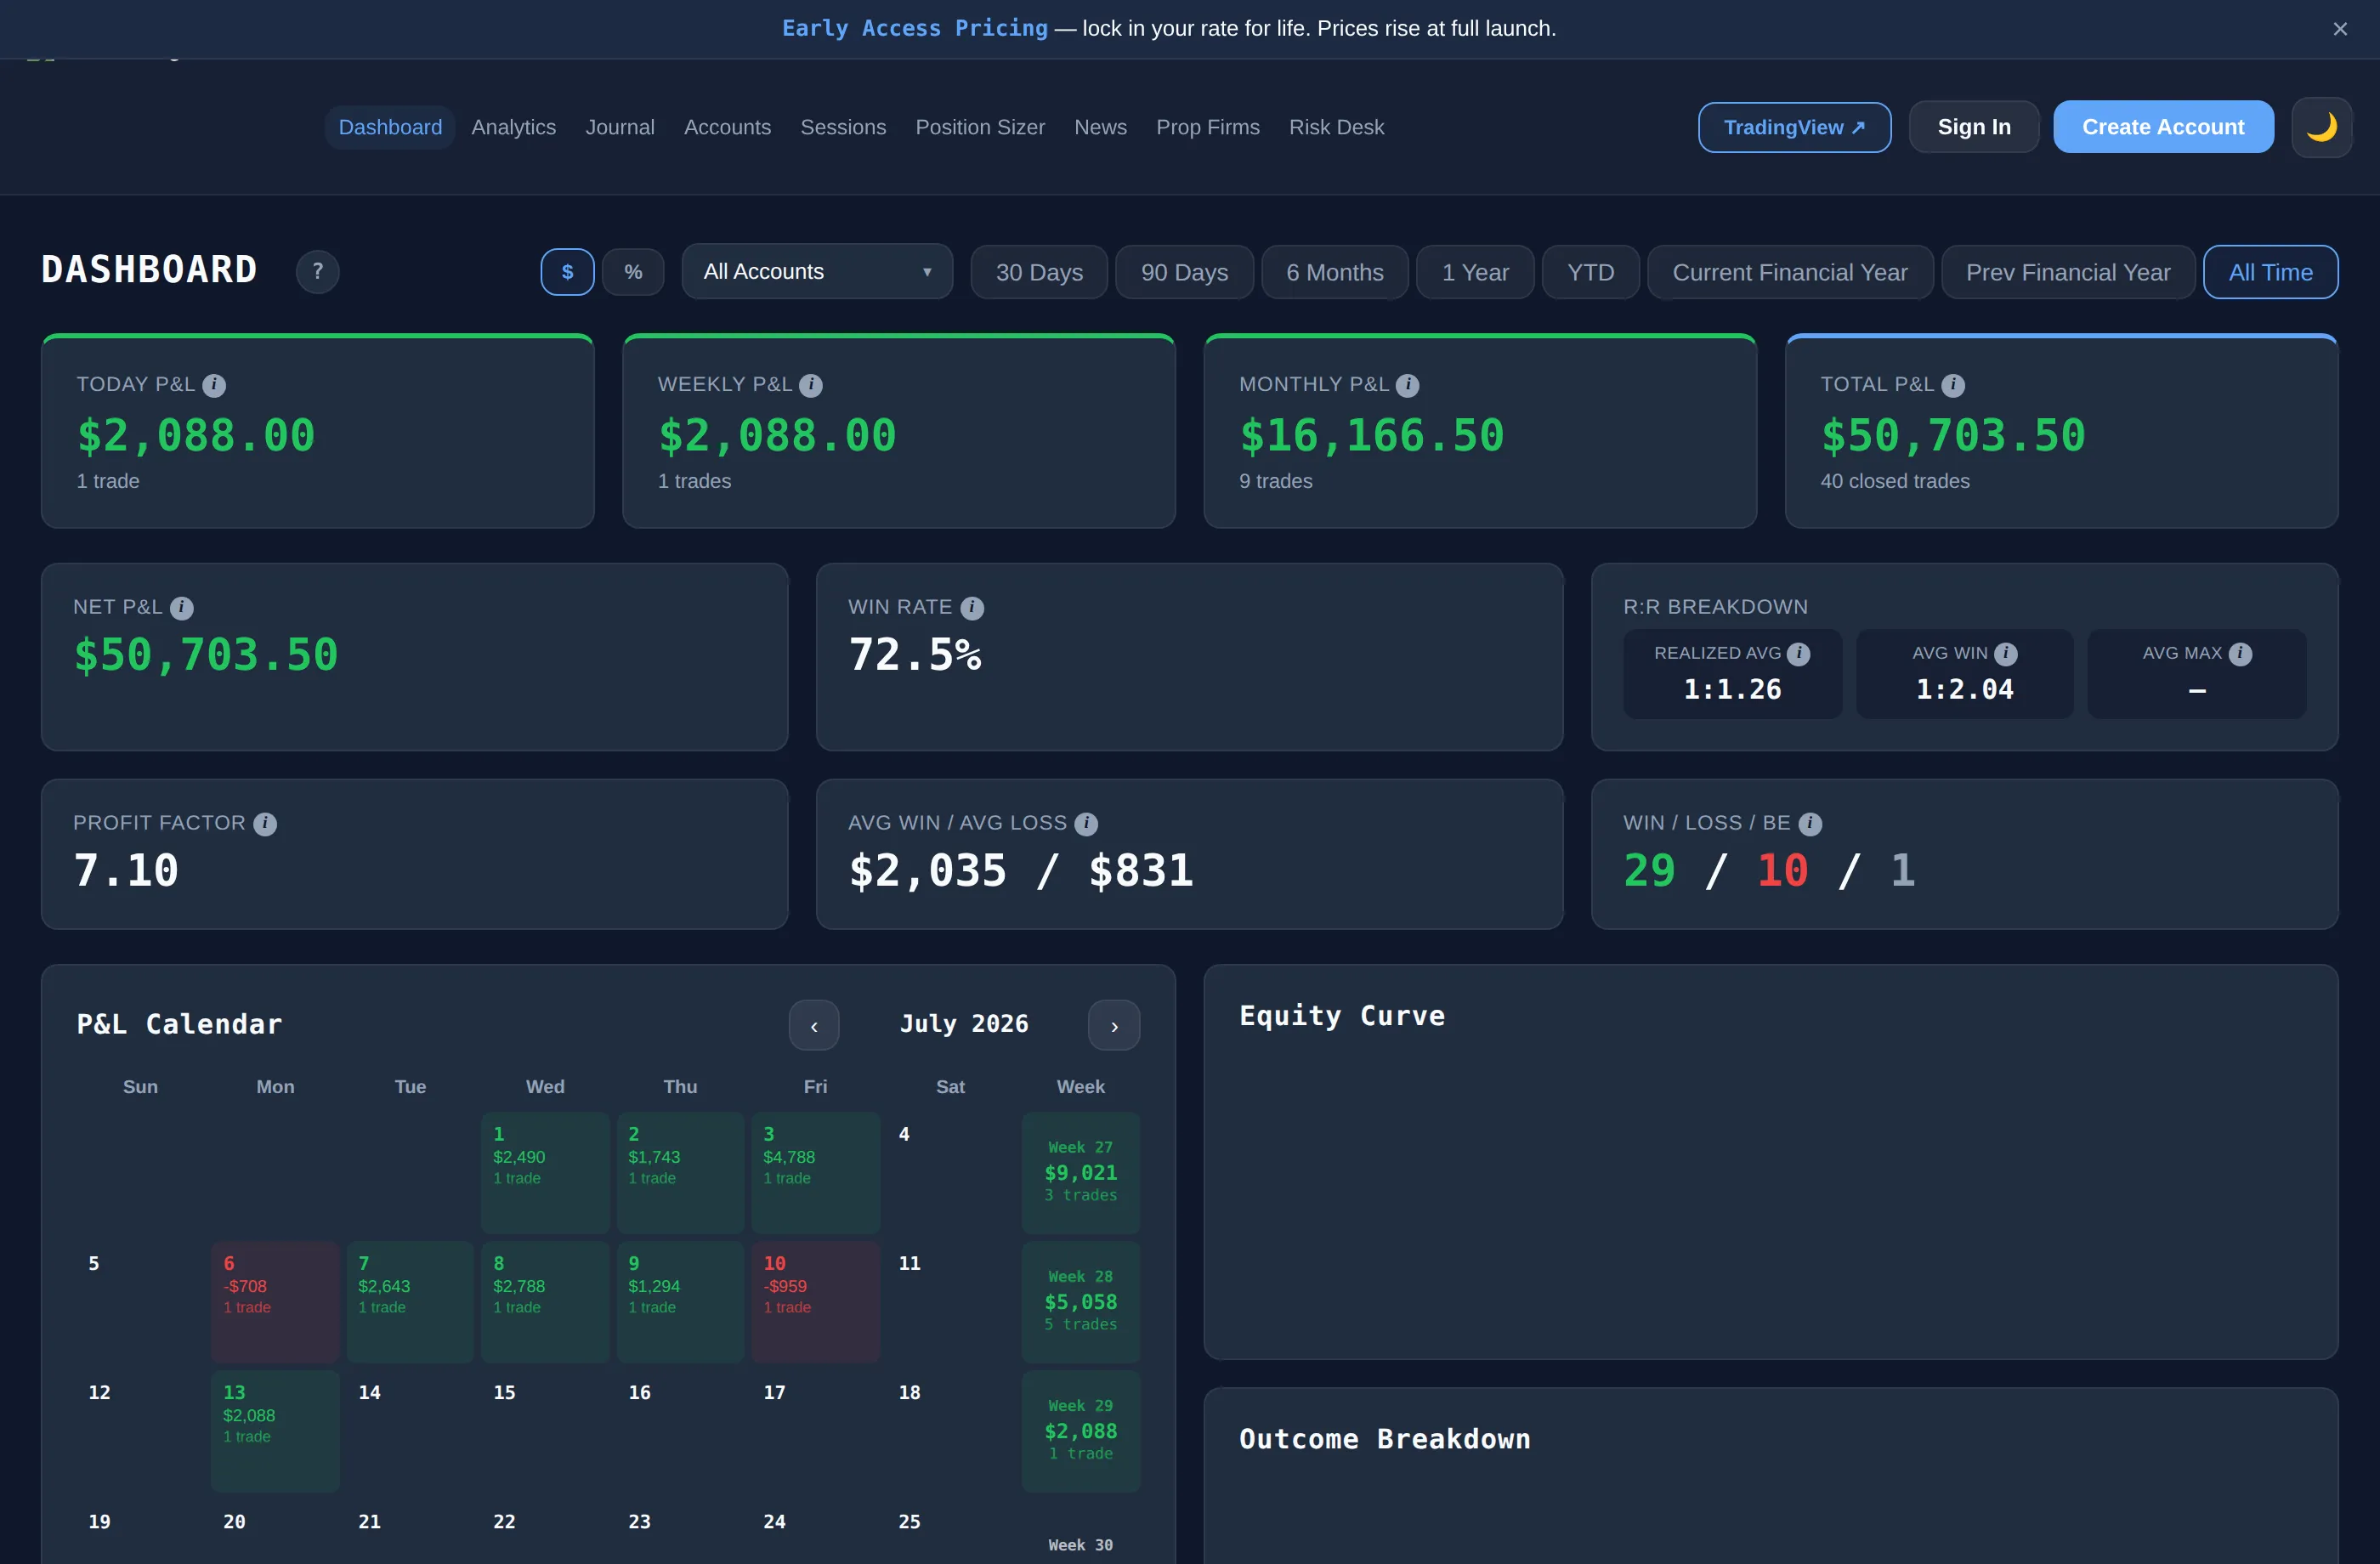
P&L by day/week/month, win rate, profit factor, equity curve, streaks, outcome breakdown. The view you check before every session.
JournalFree
Trade Journal
Every entry, exit, setup, and mistake — logged.
StatsFree
Dashboard
P&L, win rate, equity curve, calendar, streaks.
AnalysisPro
Analytics
Setup, session & day breakdowns. Mistake Cost Analysis.
RiskElite
Risk Desk
Daily budgets, breach alerts, trailing drawdown.
SyncElite
Auto-Logger
MT5 & cTrader webhooks. Trades log themselves.
SizingFree
Position Sizer
Instant lot sizing across 150+ instruments.
SessionsFree
Market Sessions
Live clocks, overlaps, volume by hour.
EventsFree
Economic Calendar
High-impact events, filtered by currency.
PlaybookFree
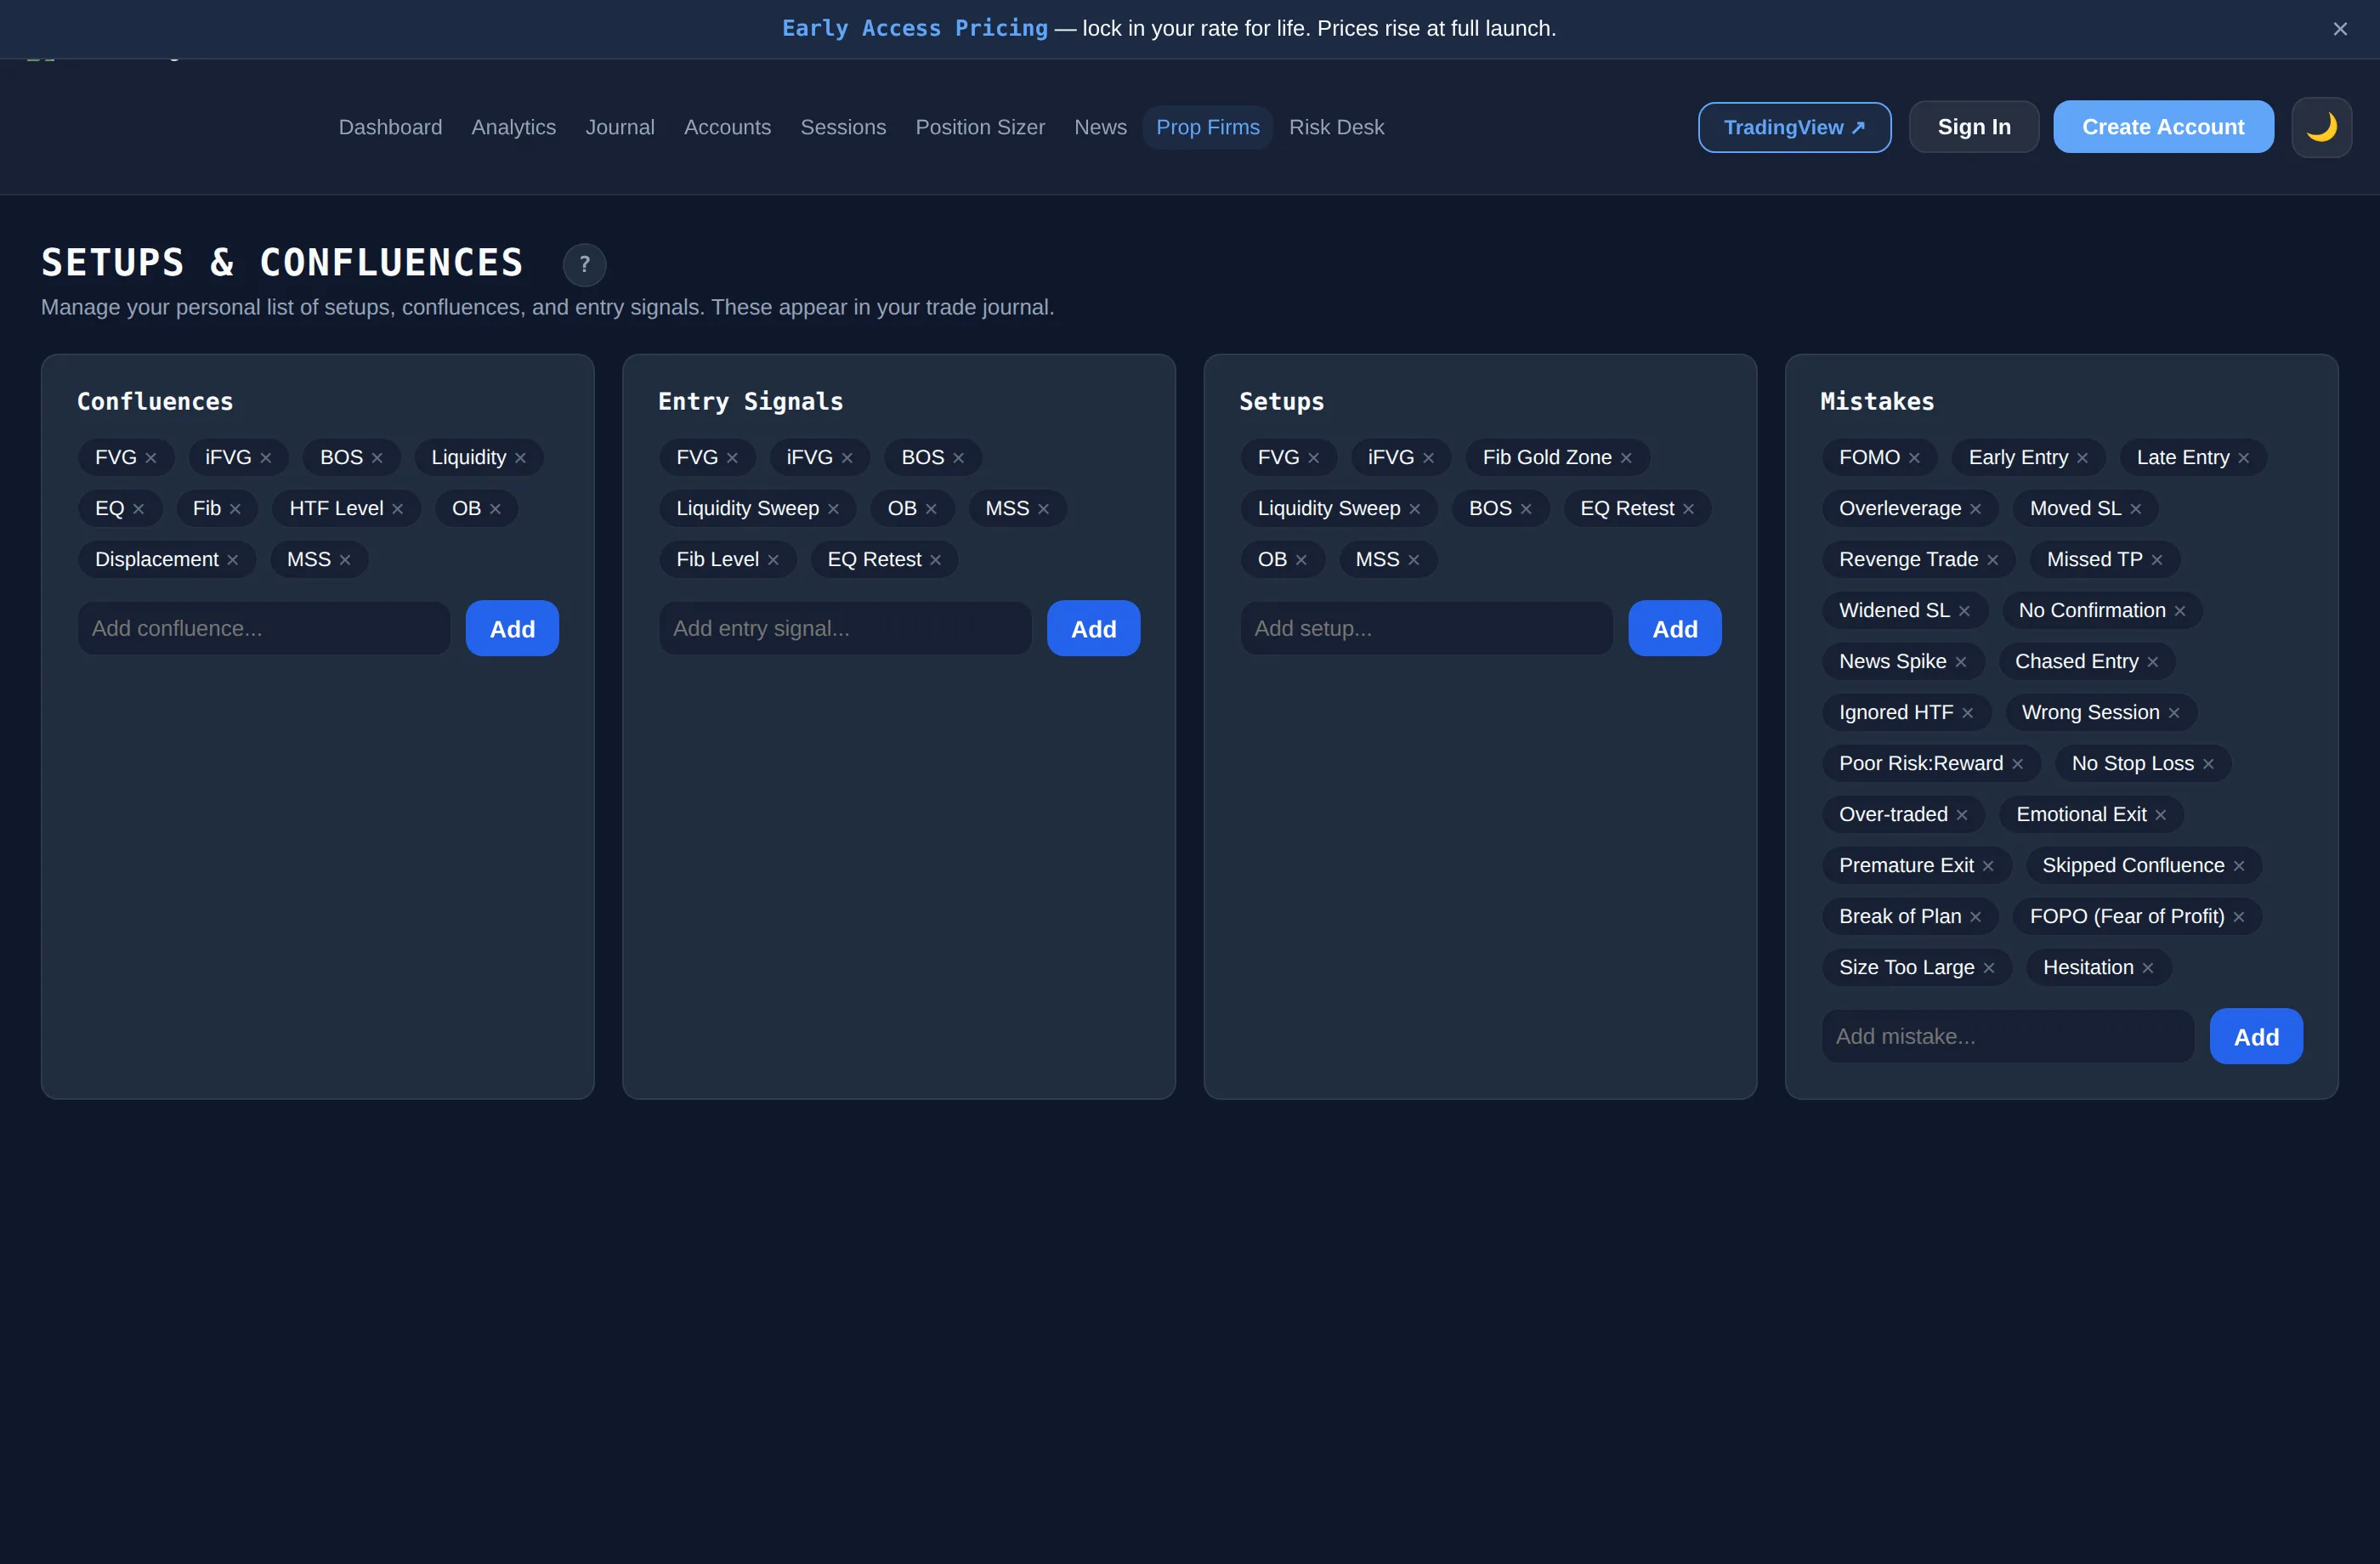
Setups & Confluences
Your trading playbook, feeding every journal entry.
IntelFree
Prop Firms
Rules, drawdown limits, profit splits — compared.
Free foreverNo card, no time limit
No ads, everEvery plan, including Free
Built for prop tradersRisk Desk, challenge tracking, drawdown alerts
Your data stays yoursExport anytime — never sold or trained on
Free forever. Upgrade when you need more.
Free $0 · Pro $19/mo · Elite $29/mo
Built by a trader who journals every trade — wins and losses.
Stop guessing. Start knowing.
No card required
SYSTEM MANIFEST
Every module in the terminal
A page-by-page look at what ships with each plan.
StatsFree
01
Dashboard
P&L, win rate, equity curve, P&L calendar, streaks, outcome breakdown. Dollar and percentage display toggle. The view you check before every session.
JournalFree
02
Trade Journal
Log every trade in full detail: entry/exit, R:R, session, setup, confluences, mistakes, screenshots, emotion and discipline ratings, grading. CSV import for existing data.
AnalysisPro
03
Analytics
Setup, session and day breakdowns, distributions, Mistake Cost Analysis — the dollar cost of every rule you break. Emotion vs P&L correlation.
RiskElite
04
Risk Desk
Daily risk budget per account, breach alerts at 70% and 90%, multi-account view, trailing drawdown tracking, prop-challenge rule enforcement.
SyncElite
05
Auto-Logger / Connections
MT5 and cTrader webhooks log your trades automatically. Merge fills within a time window, manage API keys per account.
SizingFree
Elite saves setups
06
Position Sizer
Instant lot and contract sizing across 150+ instruments. Elite tier remembers your sizing setups.
SessionsFree
Your stats: Pro
07
Market Sessions
Live session clocks, countdowns, overlaps, volume curve, 12/24h toggle. Pro shows which session you trade best in.
EventsFree
08
Economic Calendar
Live high-impact events, filtered by currency and impact level. Timezone-aware.
PlaybookFree
09
Setups & Confluences
Build your own playbook of setups and confluence factors. Feeds directly into journal entries and analytics breakdowns.
ReferenceFree
10
Prop Firms Guide
Firm rules, drawdown limits, profit splits, payout structures. Know the rules before you risk the capital.
See it for yourself
Know exactly why you win.
Log trades free, forever. Go Pro when you want the full picture.
Not a company. Not a product team. One guy, one blown account, and a journal that finally told him the truth.
Accounts blown
1
Tools replaced
5+
Trades self-journaled
100%
Ads, ever
0
The Blowup
I'm Harrison Weaver. I blew an account — but the worse part wasn't the blowup, it was everything after it. Trade after trade, week after week, the losses stacked up and I couldn't point to a single reason why. Not the strategy. Not the effort. I just had no real way to see my own trading.
The Grind
I was journaling in Notion, paying for one tool to chart, another to track, another to analyse — and still ending most weeks with a pile of screenshots and no actual answers. Which setups made me money? Which sessions quietly bled me? What was the one mistake I kept repeating? I couldn't tell you. I was flying blind, and the losses kept coming.
The Build
So I built the thing I couldn't find: one place that does all of it — journal, analytics, risk desk, sessions, sizing. No five tabs. No five subscriptions. No guessing.
Then my mate started using it, and it did the same thing for his trading that it did for mine — showed him, in black and white, what was working and what was quietly costing him. That's when it clicked: if it worked for us, it could work for the thousands of traders flying just as blind. So I opened it up.
The Mission
This isn't a product some company dreamed up to sell you. It's the tool I built to fix my own trading, and I still use it every day — every trade, win or loss, logged in here. My goal is simple: build the best trading journal in the world. Not the flashiest. Not the most expensive. The one that actually shows you why you win.
"Nothing in here is theoretical. It's all the stuff I needed, built by someone who needed it."
If you've ever stared at your own trades and felt that same not-knowing, you're exactly who I built this for.
— Harrison Weaver, Founder
No ads, ever
No data selling
Built & run by an actual trader
Your data stays yours
Try it yourself
GET IN TOUCH
Contact The Trading Terminal
Questions, feedback, or partnership enquiries — we read every message.
Support
For account, billing or product support, email us directly and we'll get back to you as soon as we can.
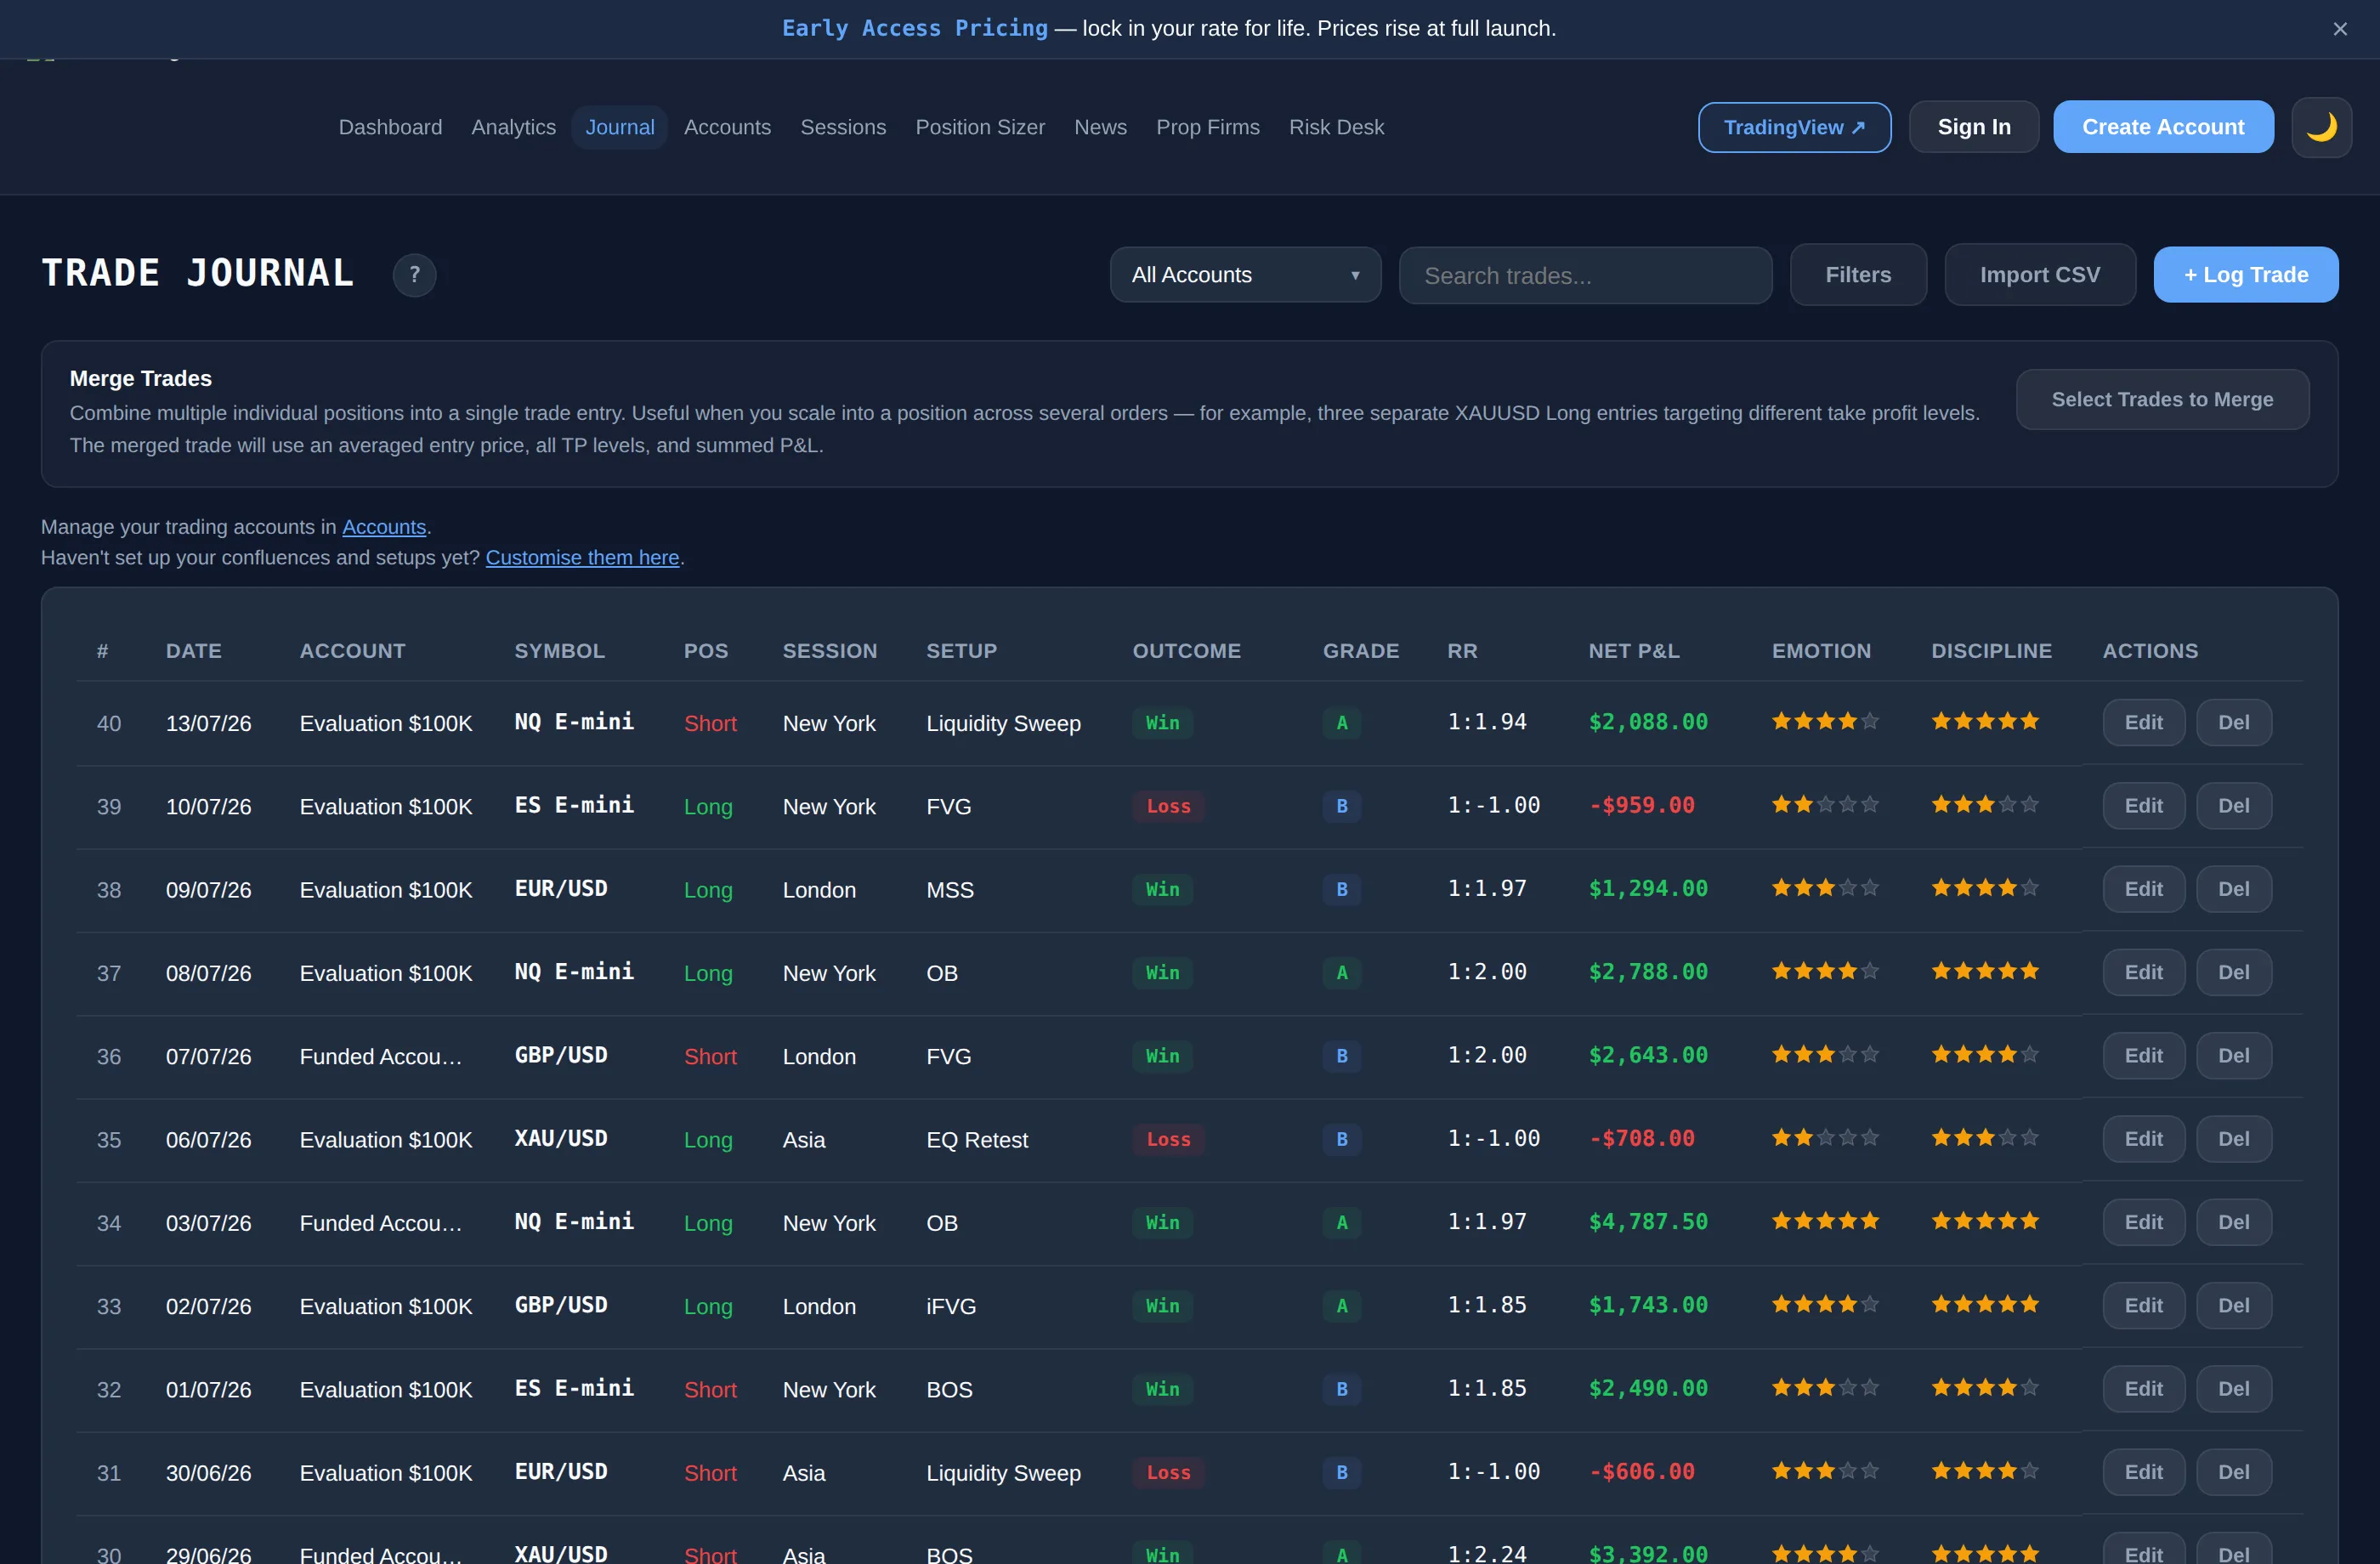
Combine multiple individual positions into a single trade entry. Useful when you scale into a position across several orders — for example, three separate XAUUSD Long entries targeting different take profit levels. The merged trade will use an averaged entry price, all TP levels, and summed P&L.
#
Date
Account
Symbol
Pos
Session
Setup
Outcome
Grade
RR
Net P&L
Emotion
Discipline
Actions
Want your trades to log automatically? Connect MT5 or cTrader.
Analytics
Setup Performance
Setup
Trades
Wins
Win Rate
Total P&L
Avg RR
Mistake Cost AnalysisWhat your rule violations actually cost
Pro Feature
See exactly how much each rule violation cost you. The single most convincing number for fixing your process.
Upgrade to Pro to unlock mistake cost analytics.
Accounts
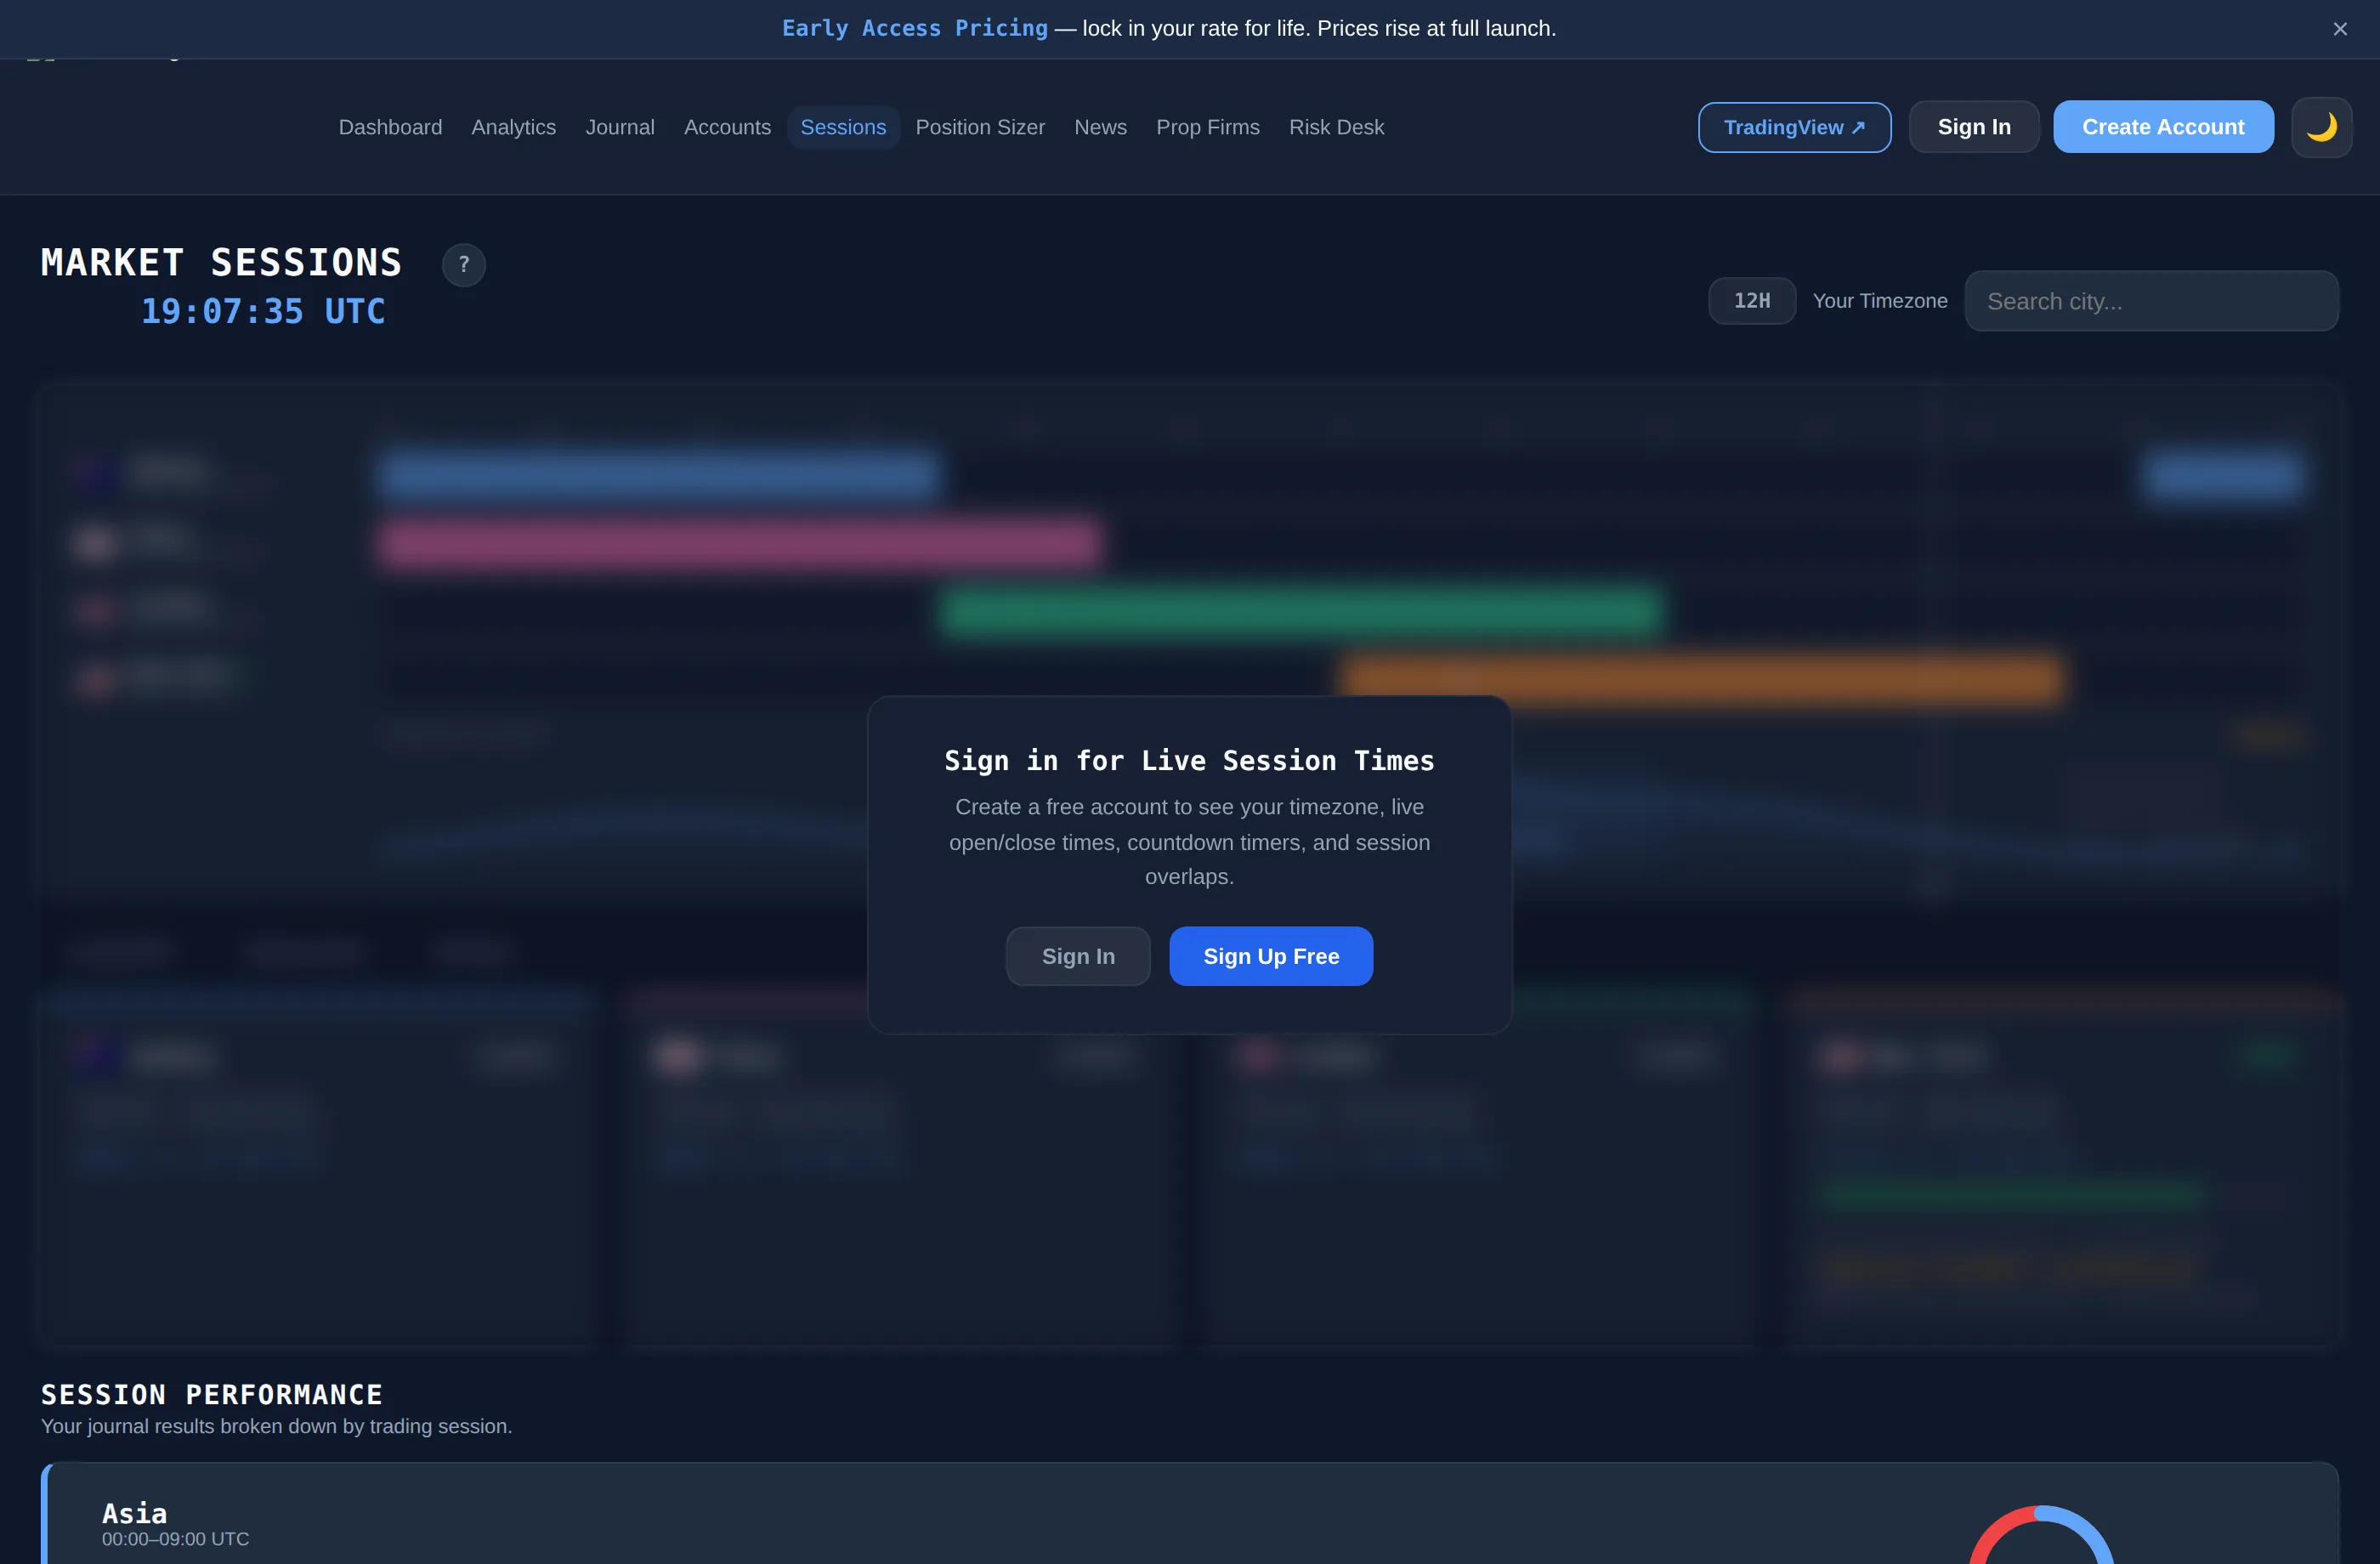
Market Sessions
--:--:-- UTC
Trading Volume
London/NY
Asia/London
NY/Asia
Sign in for Live Session Times
Create a free account to see your timezone, live open/close times, countdown timers, and session overlaps.
How to Use Market Sessions
Understanding when to trade is just as important as knowing what to trade.
Fig 1 — The Four Major Sessions
Trading Sessions
The forex market runs 24 hours on weekdays split across four major financial centres. Each session aligns with the local business day of banks and institutions in that city. More banks trading = more liquidity = tighter spreads and better fills.
Each coloured bar in the session tracker above represents when that exchange is open. When bars overlap, both sets of participants are active at the same time.
Fig 2 — Trading Volume
Why Volume Matters
High volume means more participants competing for price, which compresses spreads and reduces slippage. Trying to trade in thin markets is unpredictable — price can gap or reverse on a single order.
The volume curve at the top of the page shows typical activity across 24h UTC. The orange dashed line is your current time position on that curve. The label above the curve tells you the current volume level.
Fig 3 — Session Overlaps
Trade the Overlaps
The best opportunities arise when two sessions are open simultaneously. Volume spikes, spreads compress, and price moves with conviction as two pools of institutional flow merge.
The London/NY overlap is the most important window of the trading day. Approximately 70% of daily forex volume is concentrated across these two sessions.
London / NY · 13:00–17:00 UTC Highest volume of the day. Best for EUR/USD, GBP/USD, XAU/USD.
Asia / London · 07:00–09:00 UTC Moderate volume. EUR/JPY and GBP/JPY see increased activity.
NY / Asia · 22:00–00:00 UTC Low to moderate. AUD/USD and NZD/USD pairs active.
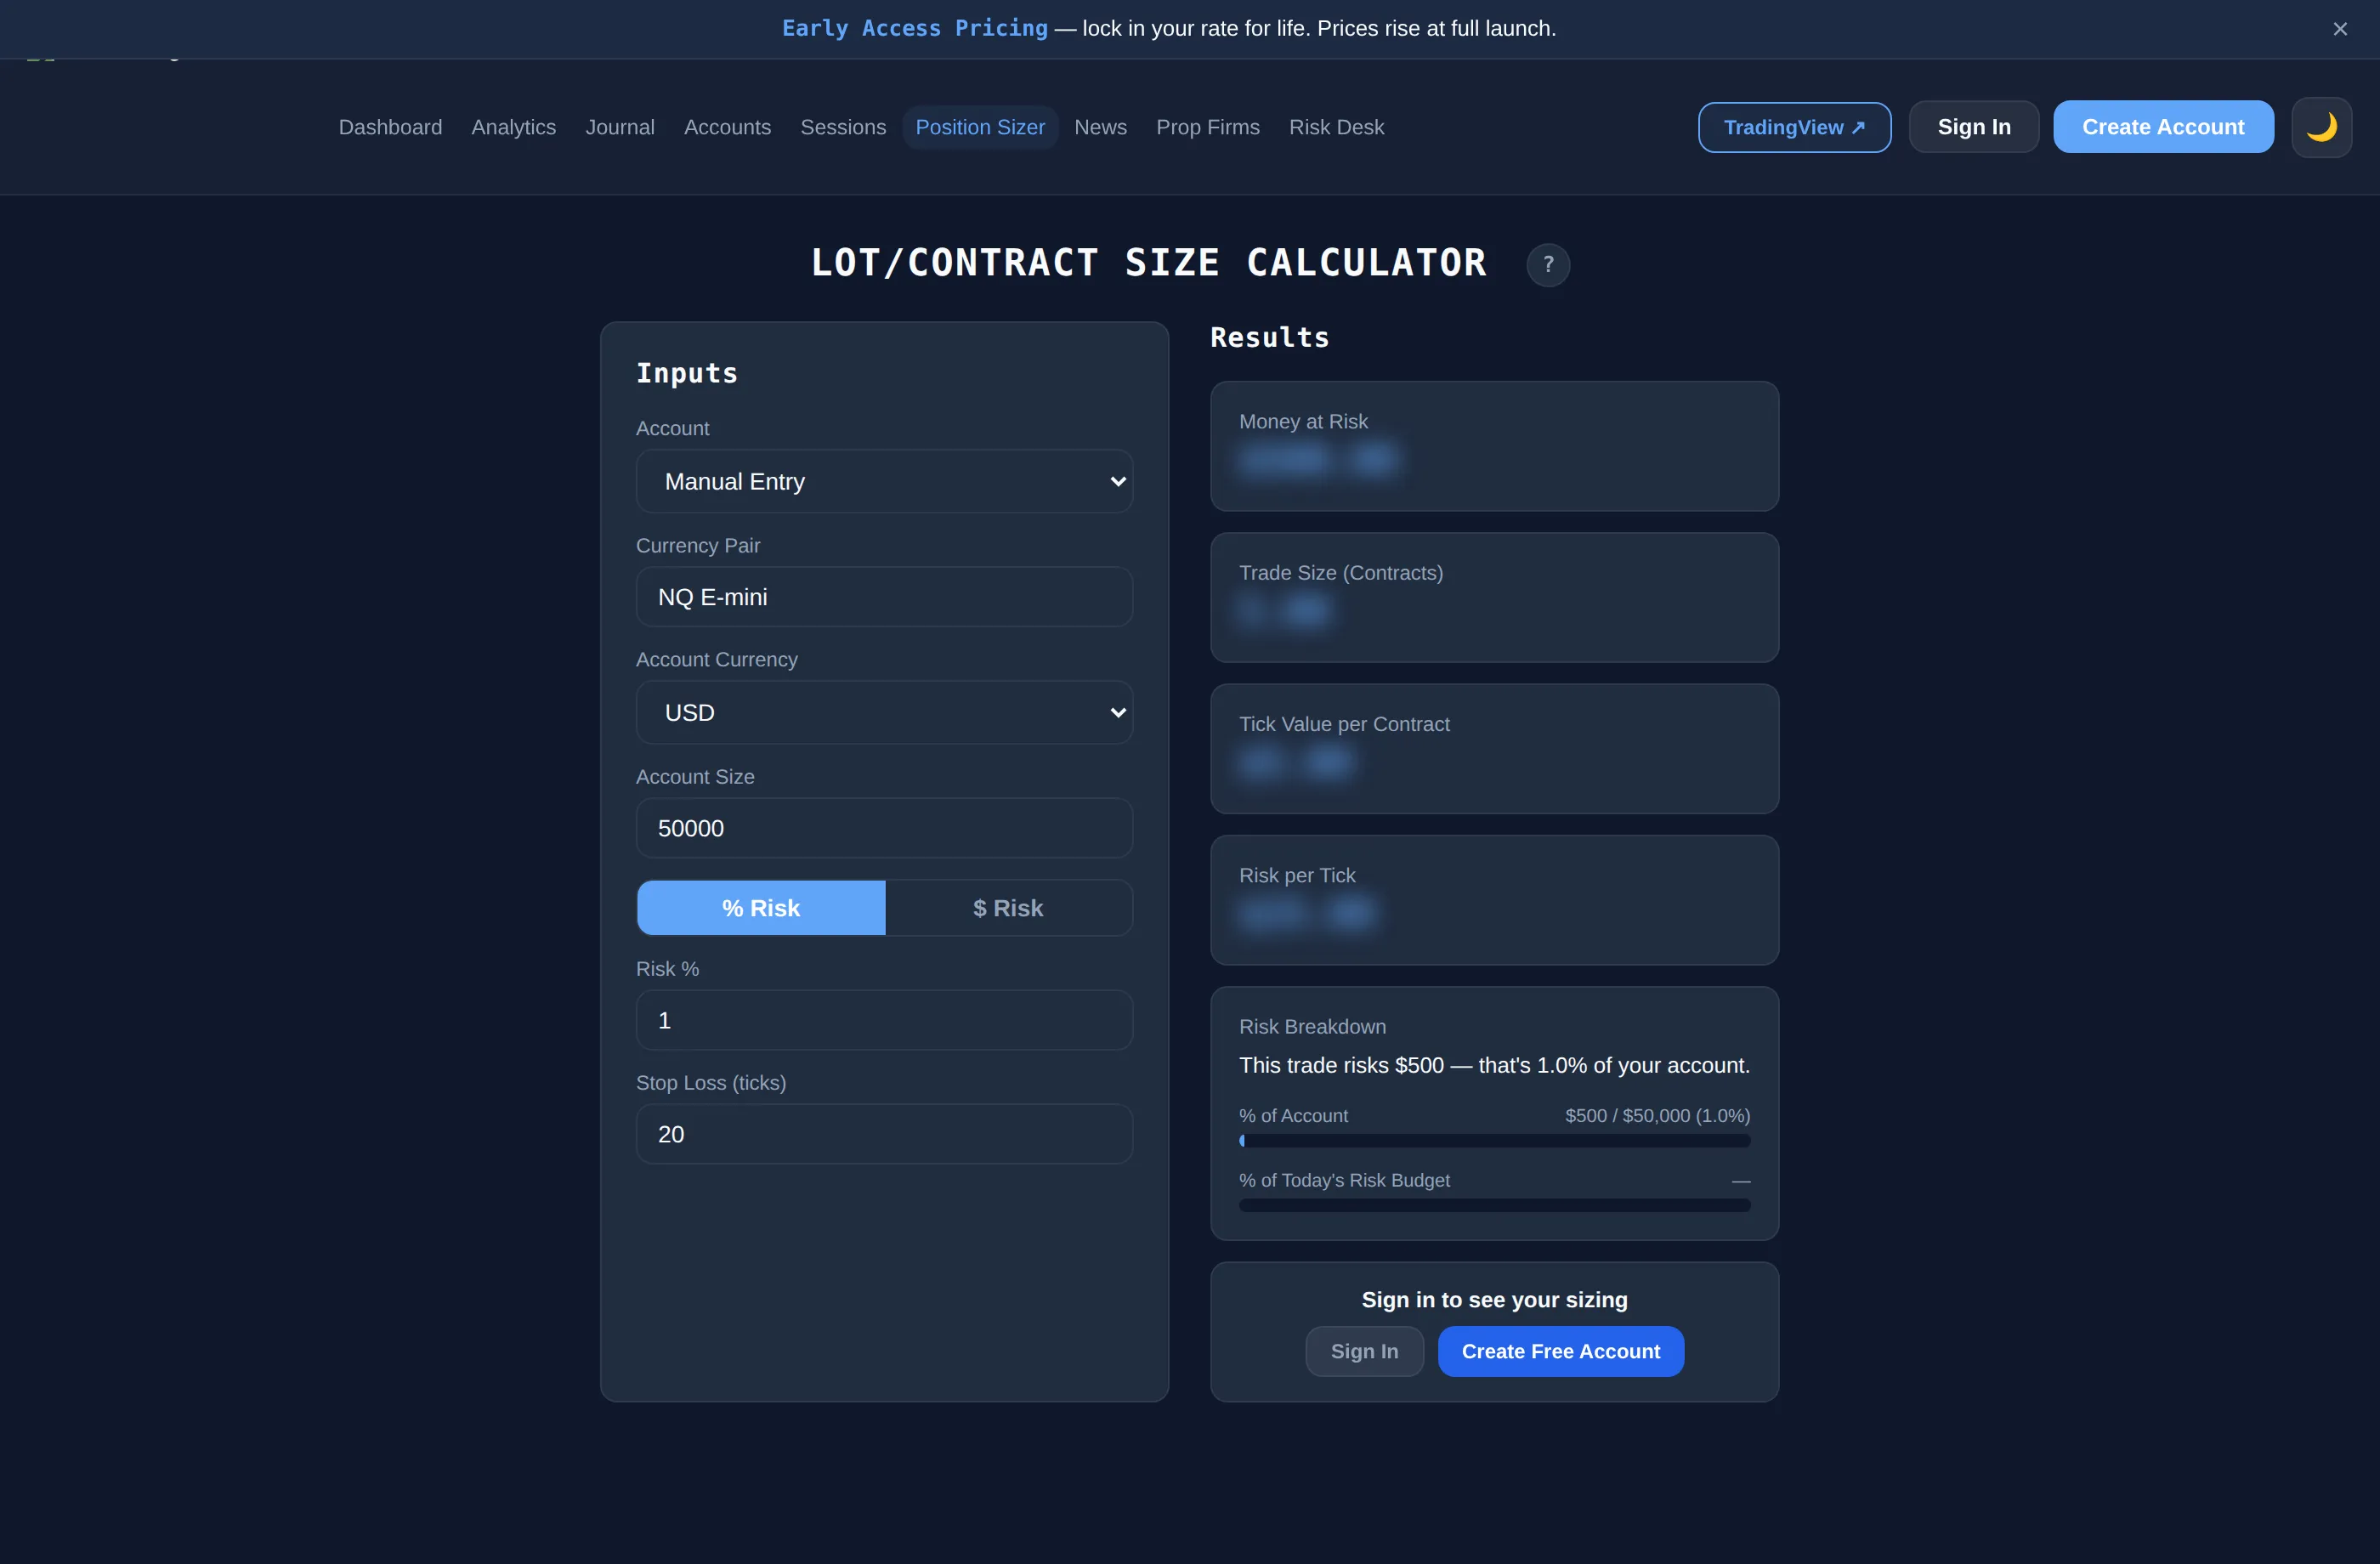
Lot/Contract Size Calculator
Inputs
Use balance
Results
Money at Risk
$0.00
Trade Size (Lots)
0.000
Units
0
Pip Value per Lot
$0.00
Risk per Pip
$0.00
Risk Breakdown
% of Account0%
% of Today's Risk Budget—
Sign in to see your sizing
Want sizing from your daily risk budget?
Risk Desk calculates your safe risk for the day from your firm's rules — size every trade off that, automatically.
Want the Position Sizer to remember your entries?
Elite saves your last symbol, account size, risk and stop loss so you don't have to re-enter them every time.
Economic Calendar
Impact
Currency
News calendar powered by Forex Factory
Setups & Confluences
Manage your personal list of setups, confluences, and entry signals. These appear in your trade journal.
Confluences
Entry Signals
Setups
Mistakes
Prop Firms
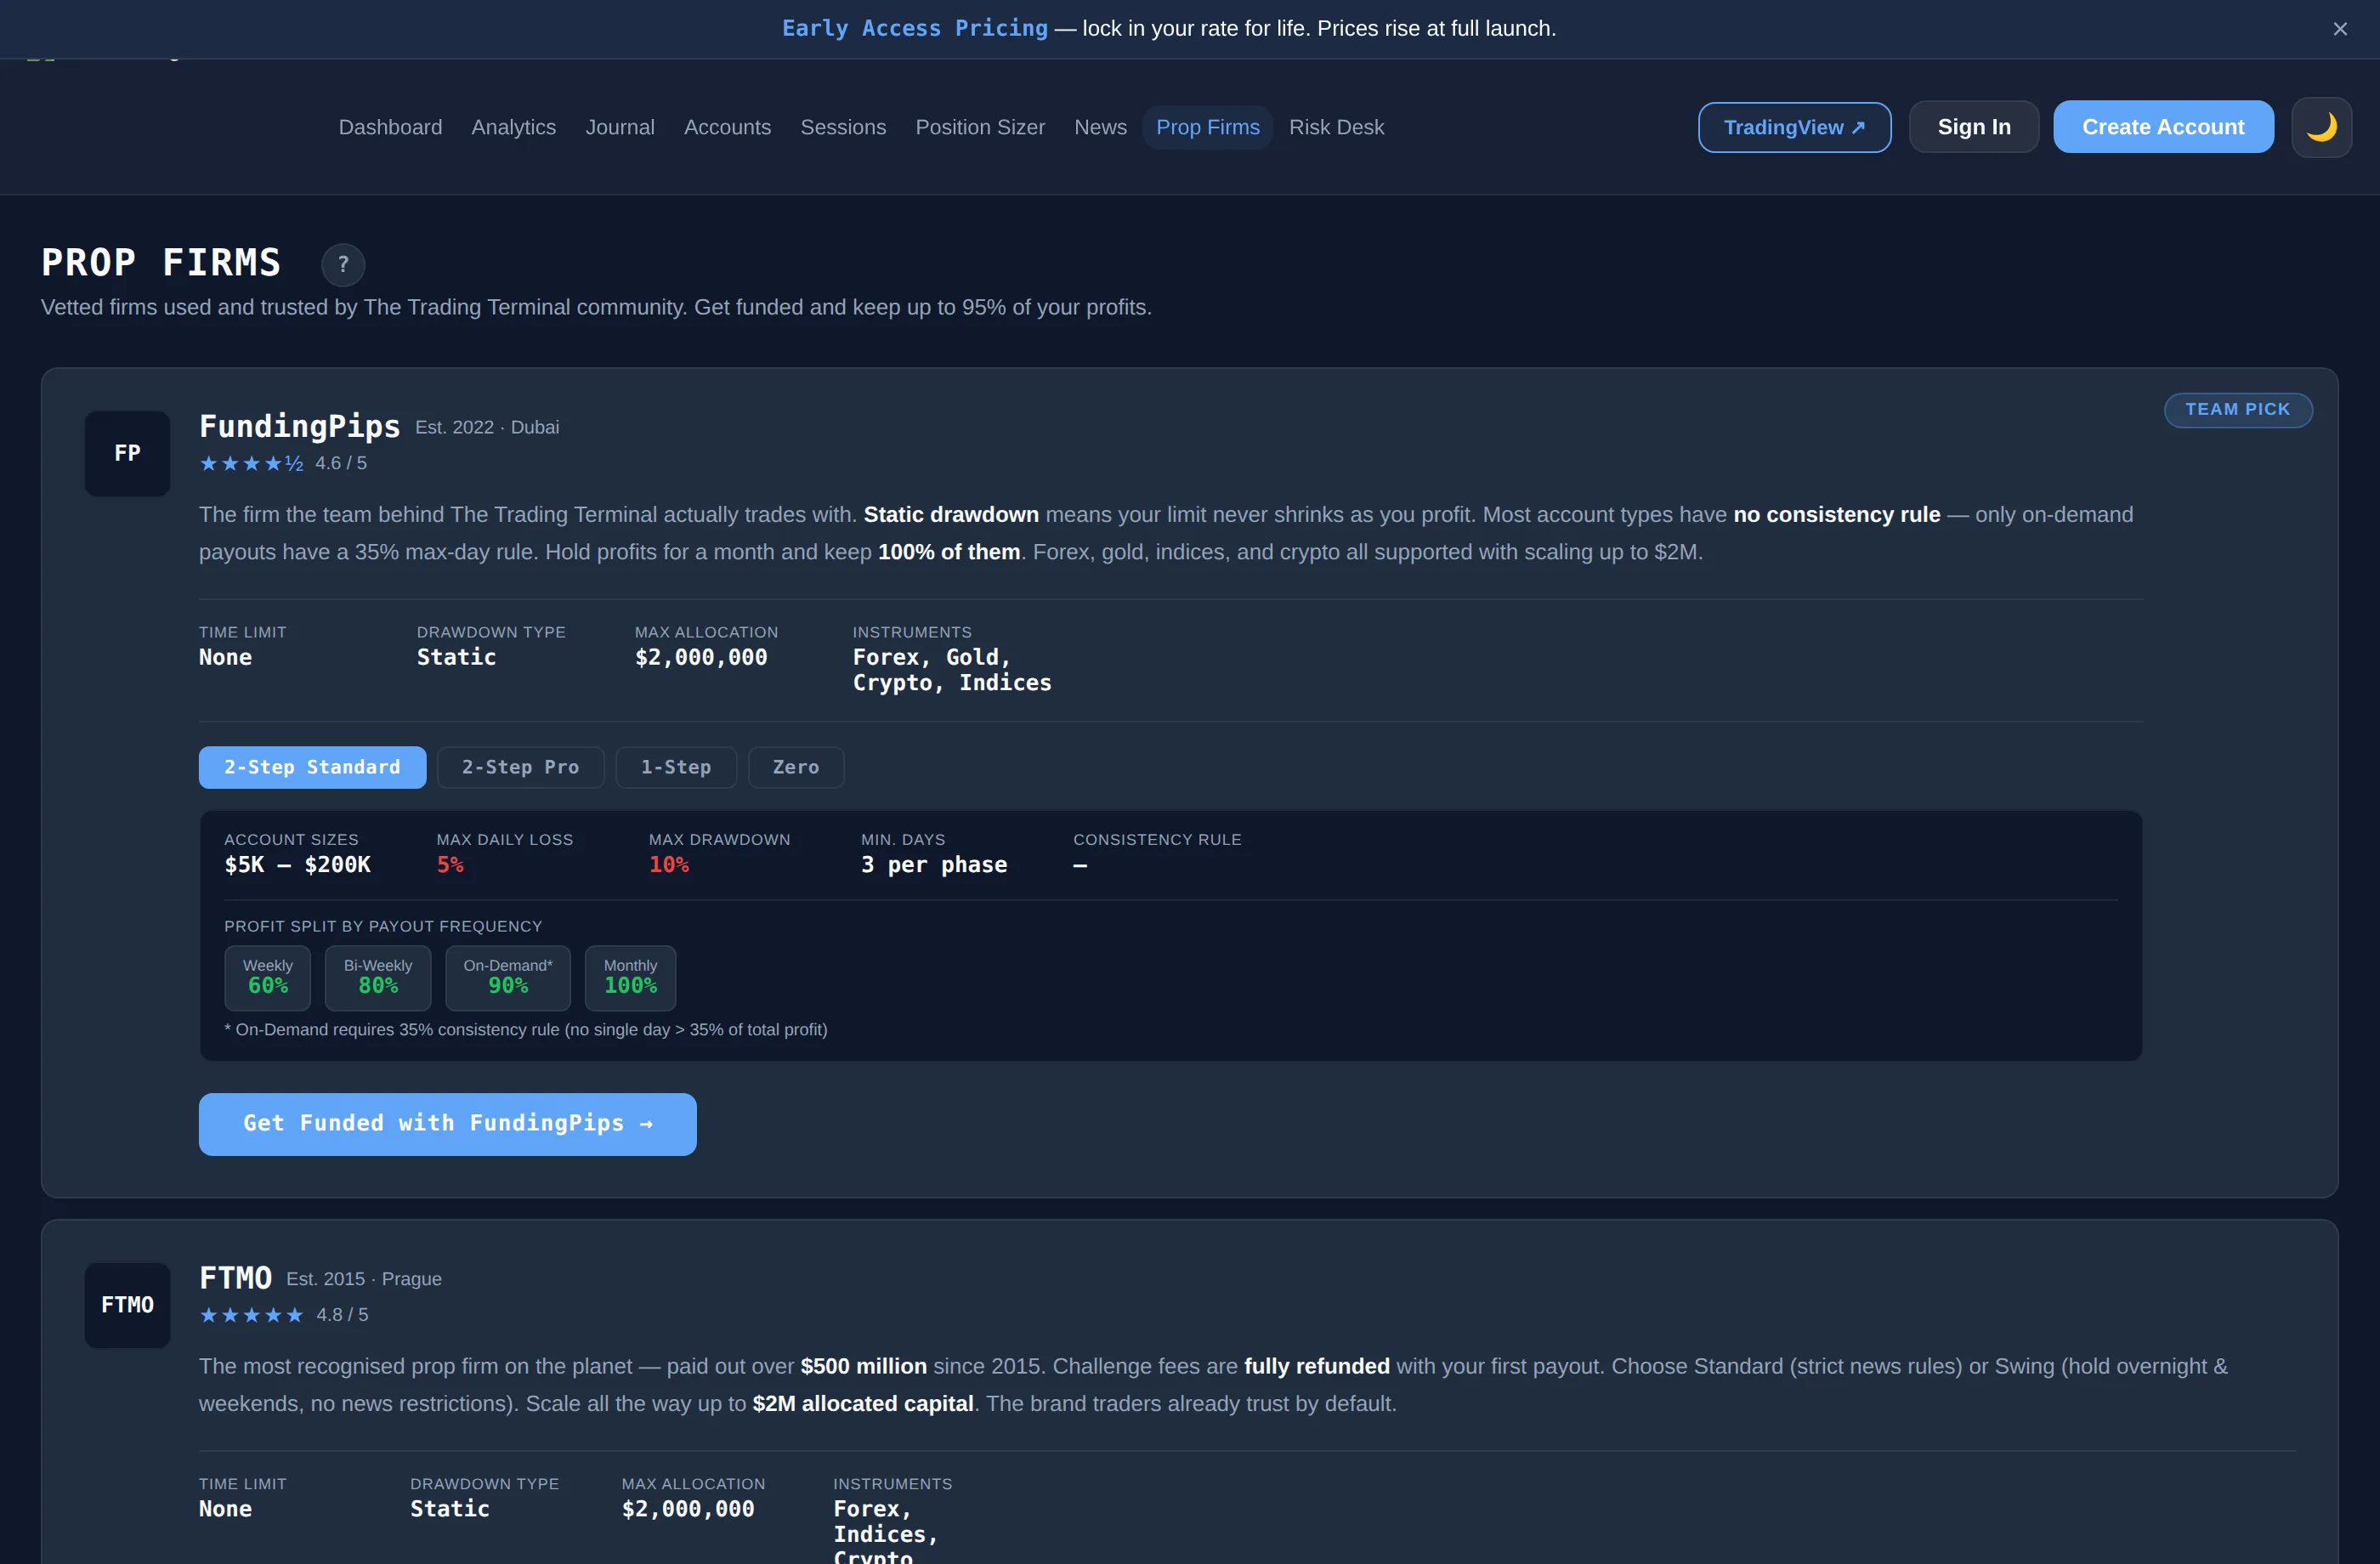
Vetted firms used and trusted by The Trading Terminal community. Get funded and keep up to 95% of your profits.
TEAM PICK
FP
FundingPipsEst. 2022 · Dubai
★★★★½4.6 / 5
The firm the team behind The Trading Terminal actually trades with. Static drawdown means your limit never shrinks as you profit. Most account types have no consistency rule — only on-demand payouts have a 35% max-day rule. Hold profits for a month and keep 100% of them. Forex, gold, indices, and crypto all supported with scaling up to $2M.
TIME LIMIT
None
DRAWDOWN TYPE
Static
MAX ALLOCATION
$2,000,000
INSTRUMENTS
Forex, Gold, Crypto, Indices
ACCOUNT SIZES
$5K – $200K
MAX DAILY LOSS
5%
MAX DRAWDOWN
10%
MIN. DAYS
3 per phase
CONSISTENCY RULE
—
PROFIT SPLIT BY PAYOUT FREQUENCY
Weekly
60%
Bi-Weekly
80%
On-Demand*
90%
Monthly
100%
* On-Demand requires 35% consistency rule (no single day > 35% of total profit)
ACCOUNT SIZES
$5K – $200K
MAX DAILY LOSS
3%
MAX DRAWDOWN
6%
MIN. DAYS
1 per phase
CONSISTENCY RULE
35% (Daily payout)
PROFIT SPLIT BY PAYOUT FREQUENCY
Daily
80%
Weekly
80%
* Daily payout requires 35% consistency rule (no single day > 35% of total profit)
ACCOUNT SIZES
$5K – $200K
MAX DAILY LOSS
5%
MAX DRAWDOWN
6%
MIN. DAYS
3 total
CONSISTENCY RULE
—
PROFIT SPLIT BY PAYOUT FREQUENCY
Weekly
60%
Bi-Weekly
80%
On-Demand*
90%
Monthly
100%
* On-Demand requires 35% consistency rule (no single day > 35% of total profit)
The most recognised prop firm on the planet — paid out over $500 million since 2015. Challenge fees are fully refunded with your first payout. Choose Standard (strict news rules) or Swing (hold overnight & weekends, no news restrictions). Scale all the way up to $2M allocated capital. The brand traders already trust by default.
TIME LIMIT
None
DRAWDOWN TYPE
Static
MAX ALLOCATION
$2,000,000
INSTRUMENTS
Forex, Indices, Crypto
ACCOUNT SIZES
$10K – $200K
MAX DAILY LOSS
5%
MAX DRAWDOWN
10%
MIN. DAYS
4 per phase
CONSISTENCY RULE
—
PROFIT SPLIT
Standard
80%
After scaling*
90%
* Scaling requires 10% profit over 4 months with ≥2 payouts. Payouts are on-demand after 14 days.
ACCOUNT SIZES
$10K – $200K
MAX DAILY LOSS
3%
MAX DRAWDOWN
10% trailing
MIN. DAYS
None
CONSISTENCY RULE
Best day <50%
PROFIT SPLIT
Standard
90%
Payouts on-demand after 14 days. Best day rule: no single day > 50% of total profit.
Futures-only prop firm with EOD trailing drawdown that never falls below your starting balance. All CME Group products including micros, crypto futures, and full-size contracts. 90% profit split across all programs. Four account types from quick evaluations to instant-funded Direct accounts. Payouts processed within 48 hours via ACH, wire, Wise, or Rise.
TIME LIMIT
None
DRAWDOWN TYPE
EOD Trailing
PROFIT SPLIT
90%
INSTRUMENTS
CME Futures (all)
ACCOUNT SIZES
$25K / $50K / $100K
PROFIT TARGET
6%
MAX DAILY LOSS
2%
MAX DRAWDOWN (MLL)
4% EOD trailing
MIN. DAYS
1
CONSISTENCY RULE
None (eval) · 40% (funded)
Subscription: from $51/mo (25K). Payouts every 5 winning days ($200+/day), up to 50% of accrued profits. Scaling plan on 50K/100K accounts.
ACCOUNT SIZES
$50K / $100K / $150K
PROFIT TARGET
6%
MAX DAILY LOSS
None
MAX DRAWDOWN (MLL)
4–4.5% EOD trailing
MIN. DAYS
3
CONSISTENCY RULE
50% (eval) · None (funded)
Subscription: from $103/mo (50K). No daily loss guard — only the MLL matters. Scaling plan available on funded accounts.
ACCOUNT SIZES
$50K / $100K / $150K
PROFIT TARGET
8%
MAX DAILY LOSS
None
MAX DRAWDOWN (MLL)
3.5% EOD trailing
MIN. DAYS
3 (eval) · 5 (payout)
CONSISTENCY RULE
50% (eval) · None (funded)
Subscription: from $136/mo (50K). Tighter MLL (3.5%) but higher profit target (8%) and no daily cap. No scaling plan.
Instant Funding — no evaluation phase
ACCOUNT SIZES
$25K / $50K / $100K / $150K
PROFIT TARGET
6% then 4%
MAX DAILY LOSS
2%
MAX DRAWDOWN (MLL)
4% EOD trailing
MIN. DAYS
None
CONSISTENCY RULE
20% max day
One-time fee: from $227 (25K). No subscription. Withdraw once you hit each profit threshold — up to 50% of profits per request. No scaling plan.
Disclosure: Some links on this page are affiliate links. If you sign up through them, The Trading Terminal may earn a commission at no extra cost to you. We only recommend firms we have researched and believe offer genuine value to traders. Always do your own due diligence before purchasing a funded account challenge.
Risk Desk
Based on closed trades logged. Open positions are not reflected.
🔒
You haven't signed in
Create a free account to start tracking your trades, saving your journal, and unlocking all features.
Log Trade
Add Account
Name is required
Your firm counts a trade as belonging to whichever "session day" is still open at trade time. Futures firms typically close at 4pm CT; forex firms typically roll at 5pm ET.
Common lock levels (verify with your firm — these can change):
• Topstep: $52,000 for a $50k combine · $103,000 for a $100k · $154,500 for a $150k
• Apex Trader Funding: starting + trail + $100 (e.g. $52,600 for a $50k, $105,100 for a $100k)
• TradeDay / Bulenox / MyFundedFutures: usually starting + trail amount
• FTMO / MyForexFunds / FundingPips: no lock — leave blank
Once your account first closes a day at or above this balance, the floor freezes at your starting balance permanently.
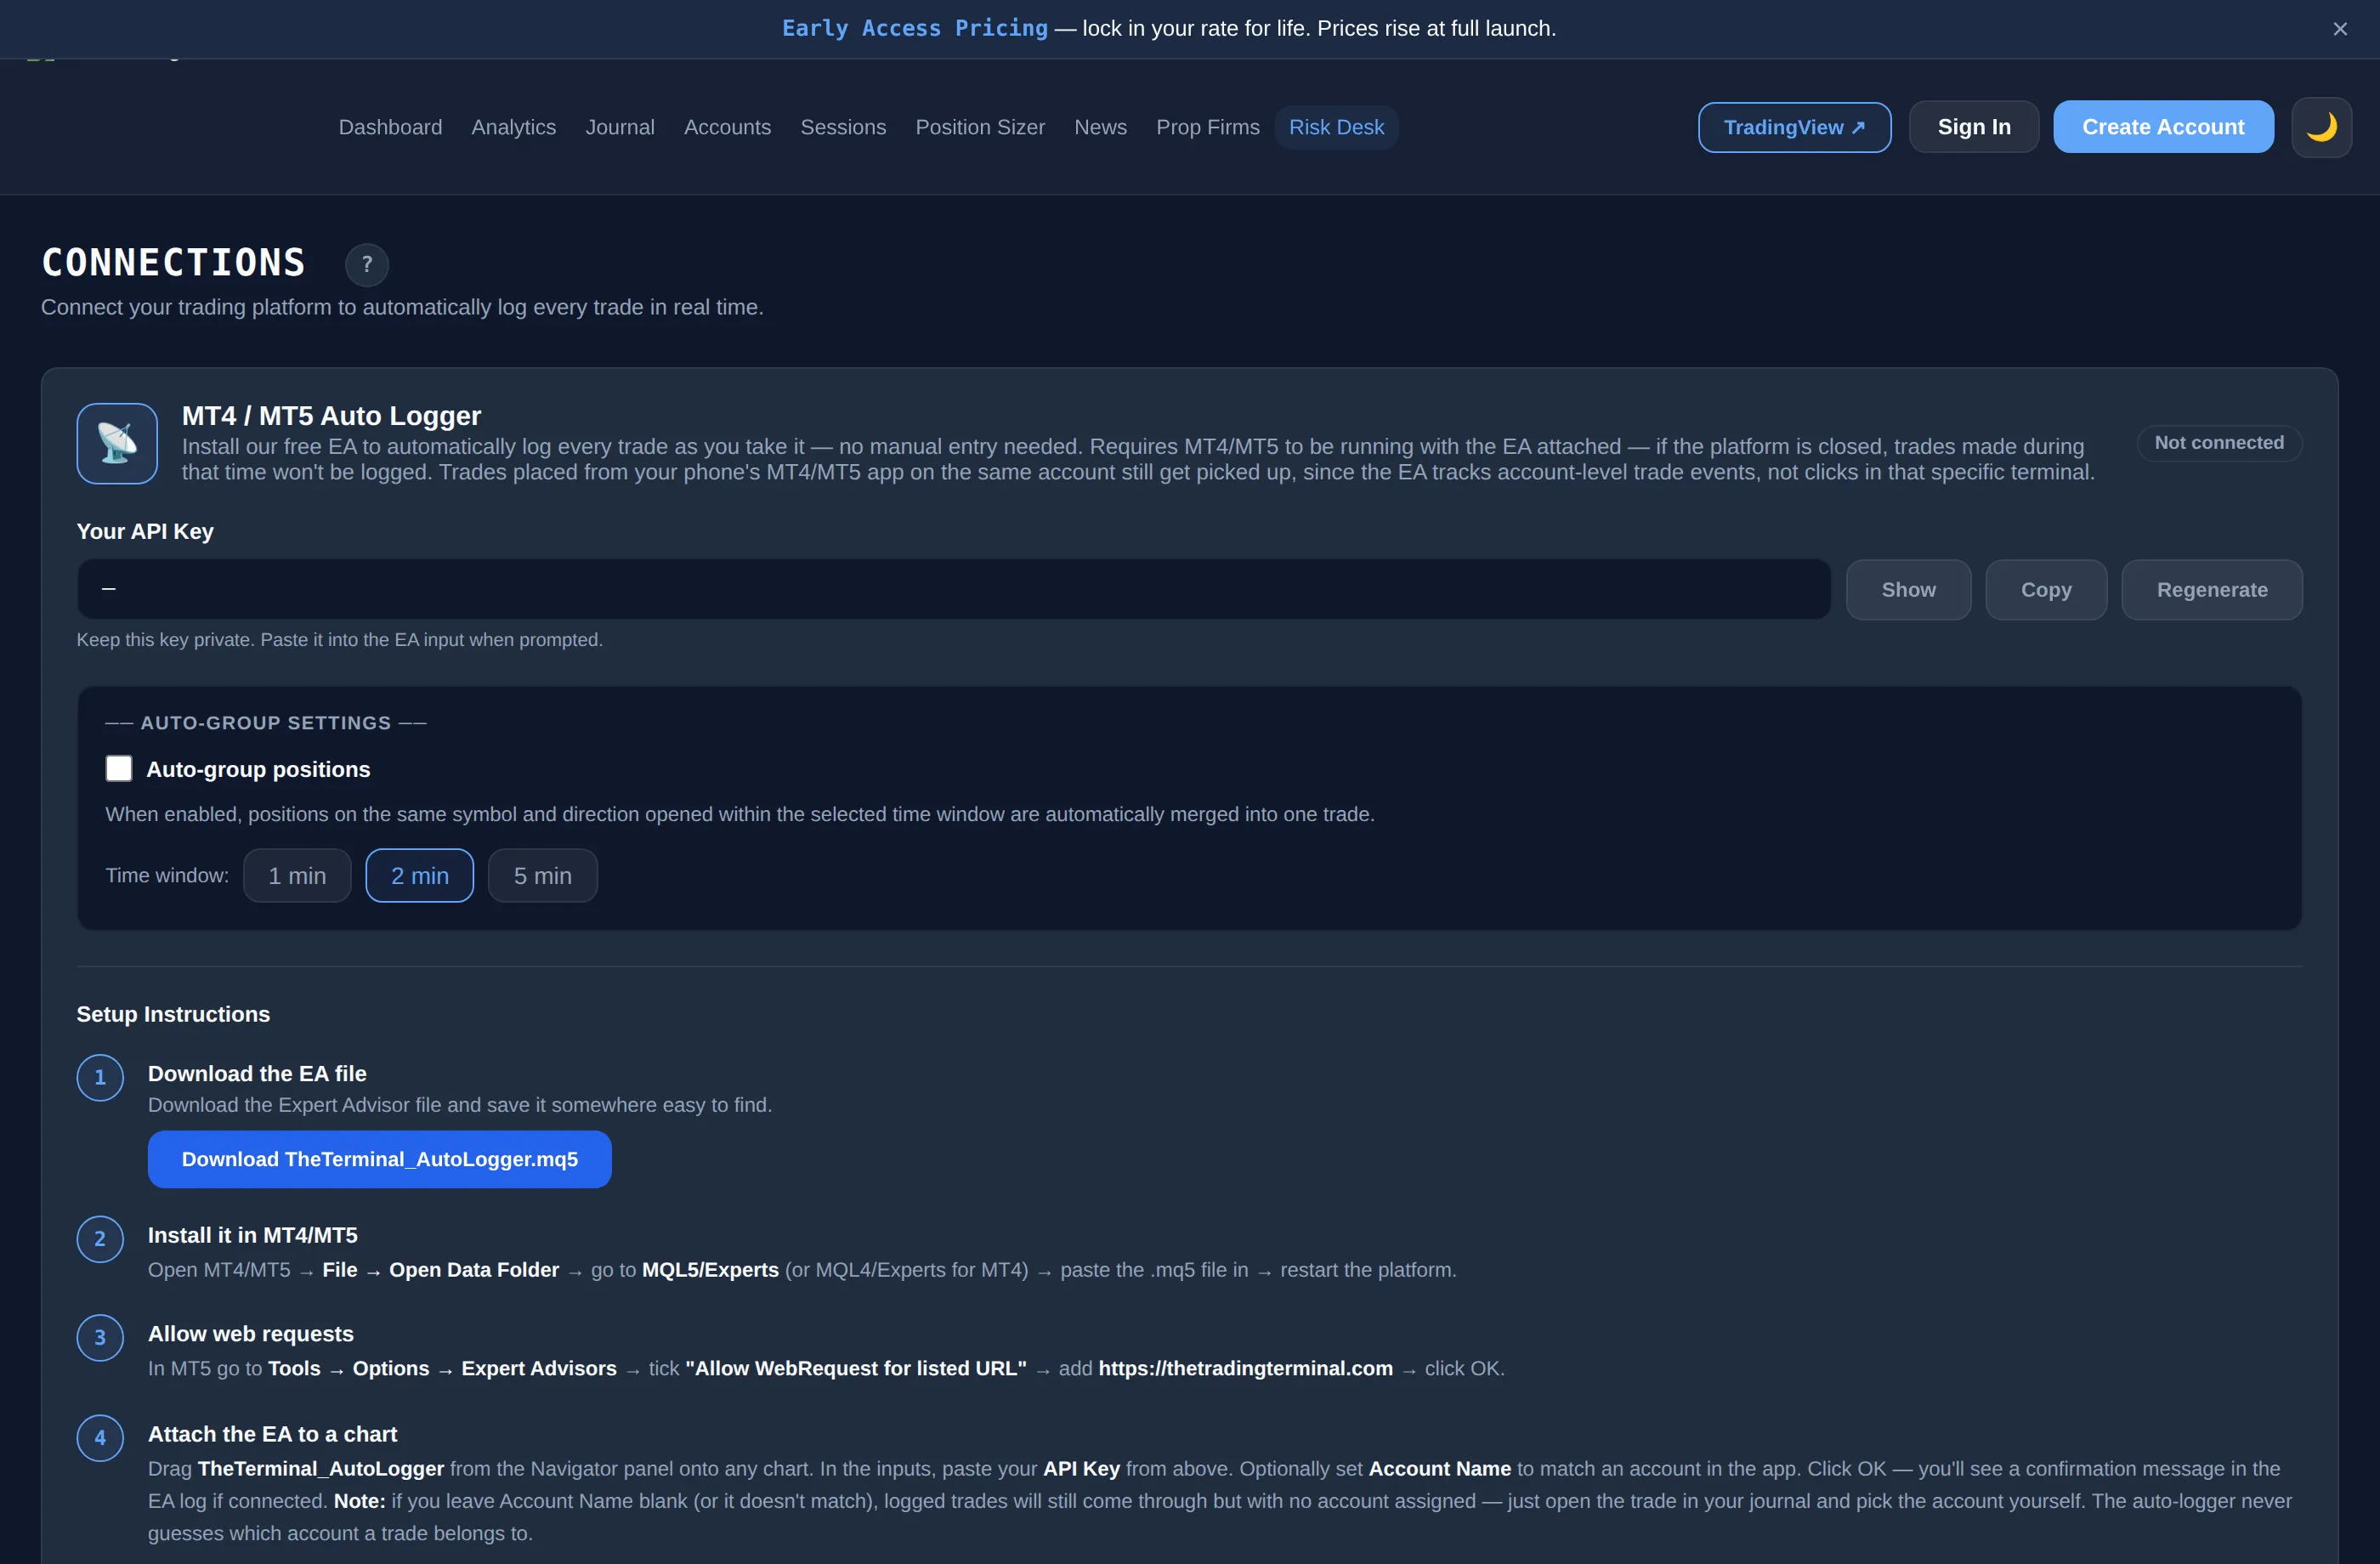
Connections
Connect your trading platform to automatically log every trade in real time.
📡
MT4 / MT5 Auto Logger
Install our free EA to automatically log every trade as you take it — no manual entry needed. Requires MT4/MT5 to be running with the EA attached — if the platform is closed, trades made during that time won't be logged. Trades placed from your phone's MT4/MT5 app on the same account still get picked up, since the EA tracks account-level trade events, not clicks in that specific terminal.
Not connected
Your API Key
—
Keep this key private. Paste it into the EA input when prompted.
── Auto-group Settings ──
When enabled, positions on the same symbol and direction opened within the selected time window are automatically merged into one trade.
Time window:
Setup Instructions
1
Download the EA file
Download the Expert Advisor file and save it somewhere easy to find.
2
Install it in MT4/MT5
Open MT4/MT5 → File → Open Data Folder → go to MQL5/Experts (or MQL4/Experts for MT4) → paste the .mq5 file in → restart the platform.
3
Allow web requests
In MT5 go to Tools → Options → Expert Advisors → tick "Allow WebRequest for listed URL" → add https://thetradingterminal.com → click OK.
4
Attach the EA to a chart
Drag TheTerminal_AutoLogger from the Navigator panel onto any chart. In the inputs, paste your API Key from above. Optionally set Account Name to match an account in the app. Click OK — you'll see a confirmation message in the EA log if connected. Note: if you leave Account Name blank (or it doesn't match), logged trades will still come through but with no account assigned — just open the trade in your journal and pick the account yourself. The auto-logger never guesses which account a trade belongs to.
✓
Done — trades log automatically
From now on every trade you open or close in MT5 will appear in your Journal automatically. You can still edit trades to add notes, screenshots, discipline ratings etc.
🤖
cTrader Auto Logger
Install our free cBot to automatically log every trade directly from cTrader. Requires cTrader to be running with the bot started — if it's closed, trades made during that time won't be logged. Trades placed from your phone's cTrader app on the same account still get picked up, since the cBot tracks account-level trade events, not clicks in that specific terminal.
Setup Instructions
1
Copy your API Key
You'll need your API Key from the MT5 card above — it works across all platforms.
2
Download the cBot
Download the .algo file and save it somewhere easy to find.
3
Install the cBot
In cTrader go to Automate → click Import → select the downloaded .algo file. The bot will appear under My Robots.
4
Add to a chart & enter your key
Double-click TheTerminal_AutoLogger → in the Parameters panel paste your API Key → click Start. A connection test runs on startup — check the log for confirmation. Note: if Account Name is left blank (or doesn't match one of your accounts in the app), trades still log automatically but with no account assigned — open them in your journal and pick the account yourself. It never guesses which account a trade belongs to.
✓
Done — trades log automatically
Every trade you open or close in cTrader now appears in your Journal. You can still edit trades to add notes, screenshots, and discipline ratings.
Stop guessing why you win.
Journal free forever. Upgrade when you're ready to find your edge.
Already paid but your plan isn't showing right?
MonthlyAnnualSave up to $99 →
🚫 No ads, ever·↩️ Cancel anytime·🔒 Your data stays yours·💳 No card required for Free
Supports MT4/MT5, cTrader, Tradovate, or generic CSV exports
Map your CSV columns
We couldn't auto-detect all columns. Please map your CSV columns to the fields below:
How to Import a CSV with a Different Layout
Follow these steps to convert your export into The Trading Terminal format
1
Export your trade history from your platform
Go to your broker or trading platform and export your closed trade history as a CSV file. Most platforms have this option under Account History, Reports, or Trade History. Save the file somewhere you can find it.
Common platform export locations:
• MT4/MT5 → Account History tab → right click → Save as Report
• cTrader → History → Export
• Tradovate → Reports → Trade History → Export
• NinjaTrader → Account Performance → Export
• Rithmic → Trade Routing → Export
• TastyTrade → History → Download
2
Download The Trading Terminal template
Download our template CSV — it shows the exact column names and format we expect. You'll use this alongside your export in the next step.
What the template looks like:
date
exit_date
symbol
position
entry_price
sl_price
tp_price
gross_pnl
fees
net_pnl
outcome
2024-01-15
2024-01-15
EUR/USD
Long
1.09250
1.08900
1.09800
125.00
3.50
121.50
Win
2024-01-16
2024-01-16
GBP/USD
Short
1.27100
1.27500
1.26400
-80.00
3.50
-83.50
Loss
• date / exit_date — YYYY-MM-DD
• position — Long or Short
• net_pnl — after fees, can be negative
• outcome — Win / Loss / Breakeven
3
Reformat your data using AI — takes about 10 seconds
Copy the prompt below, then open ChatGPT or Claude. Paste the prompt, then paste your entire CSV export underneath it where it says [PASTE YOUR CSV HERE]. Hit send — it'll give you back a perfectly formatted file ready to import.
AI Prompt — copy this:
4
Import your reformatted file
Save the CSV the AI gives you, then come back to the import screen. Select Generic as the platform and upload your new file. It'll map straight in.