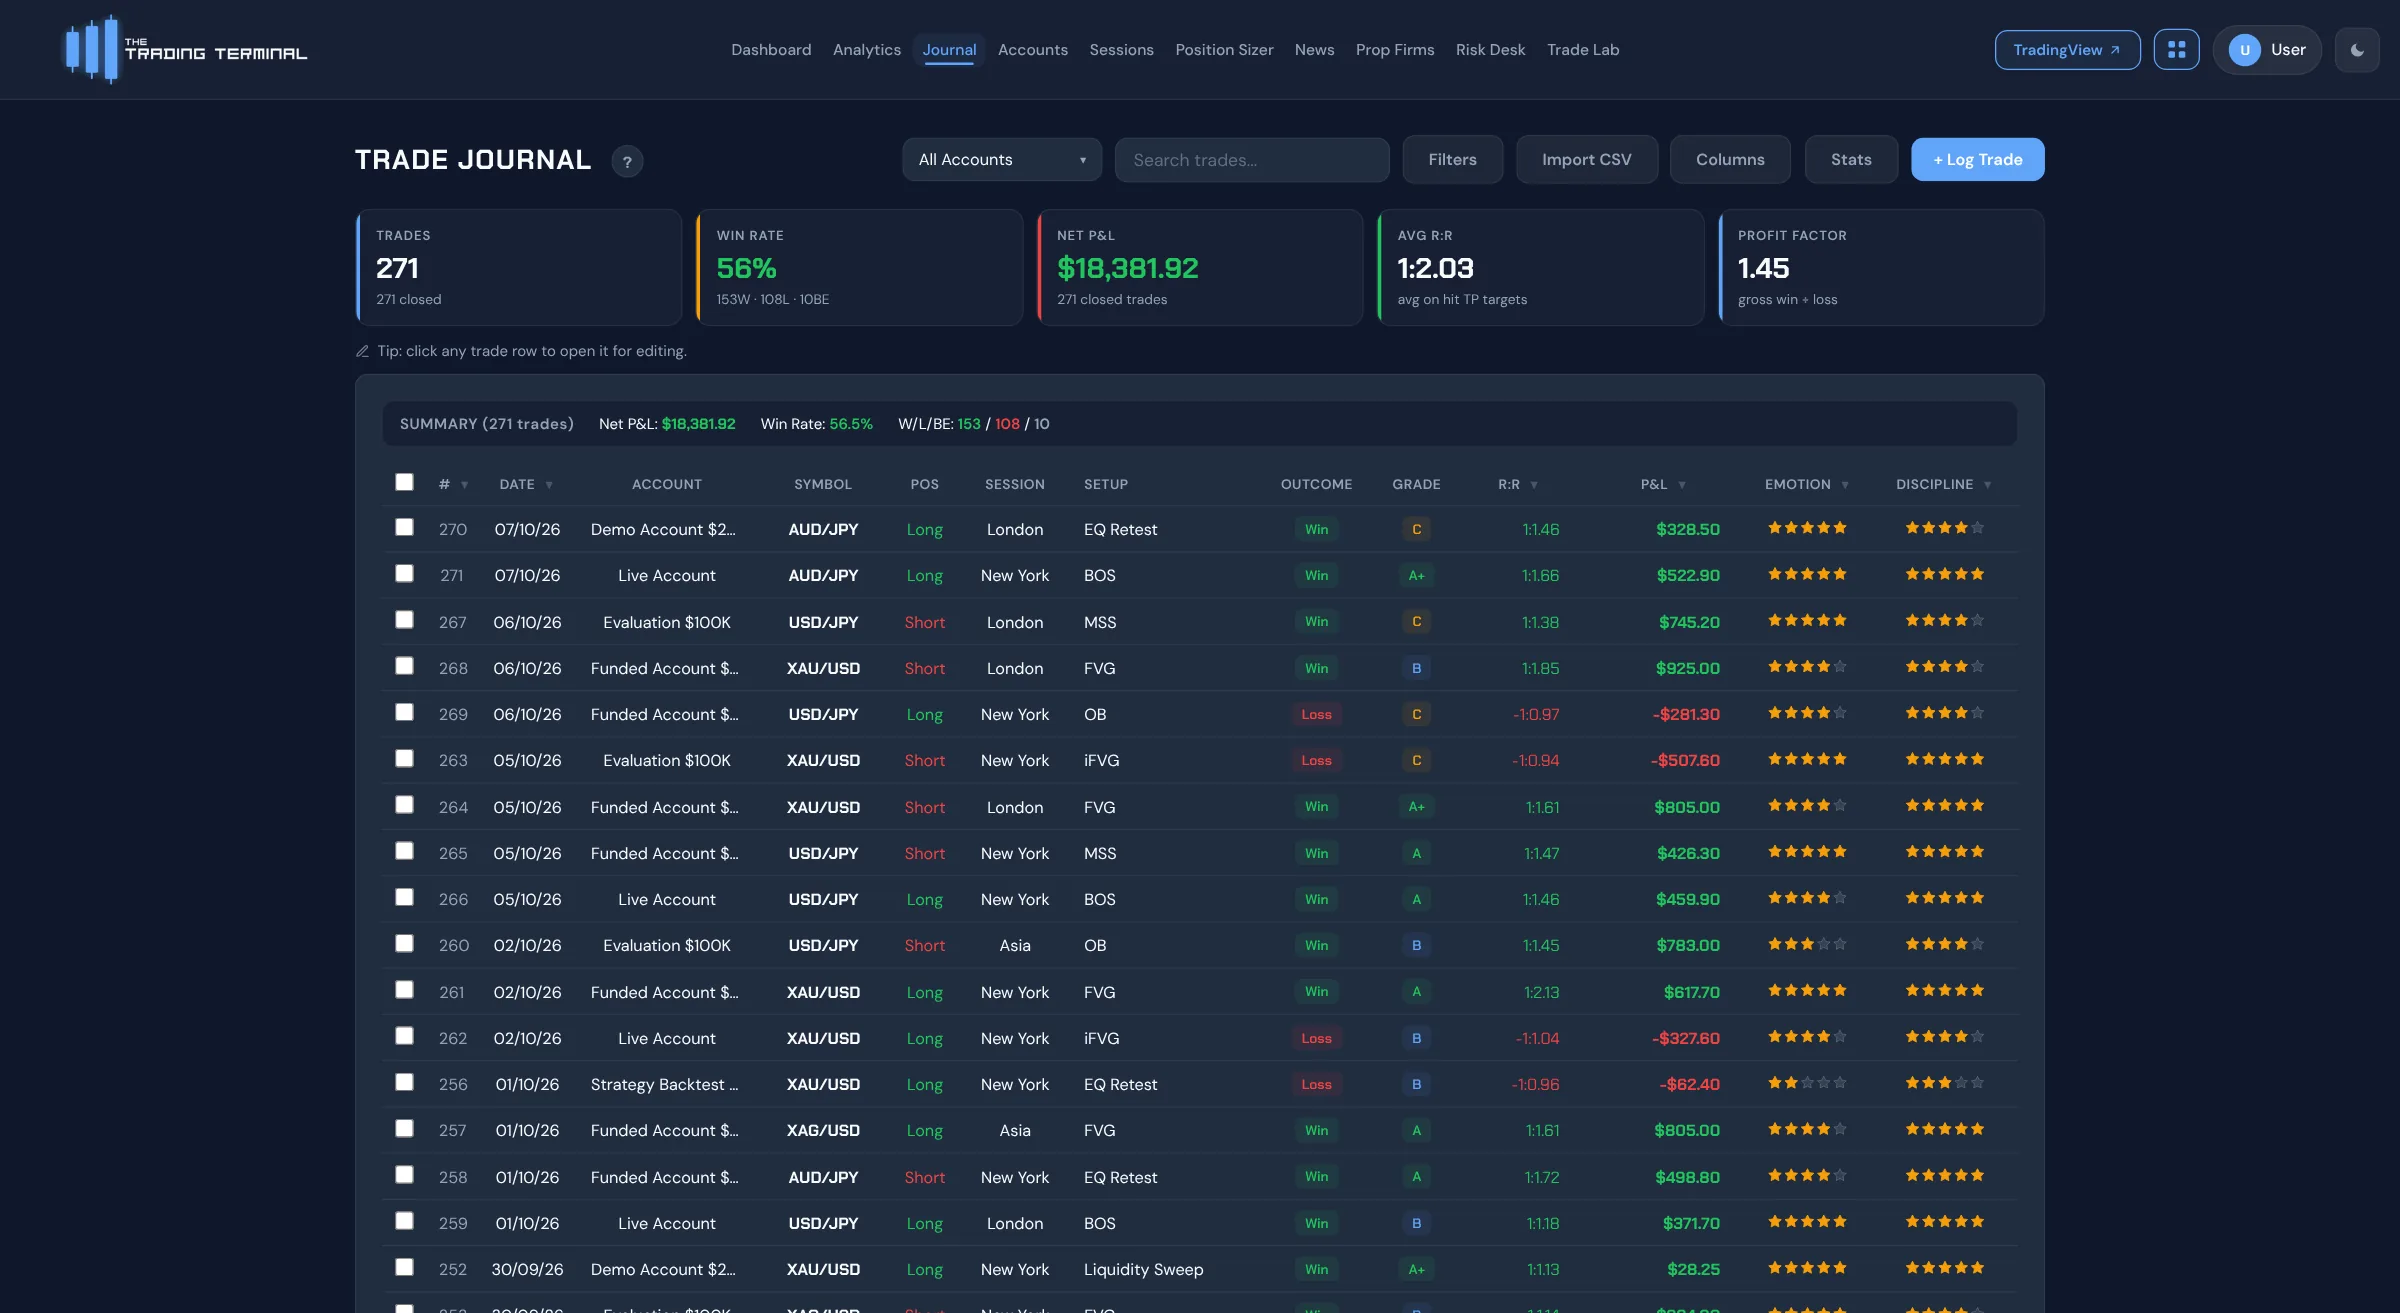
Trading Journal Examples: Filled-In Entries for Each Trading Style
These trading journal examples show what a filled-in entry looks like for a day trade, a swing trade, a losing trade, a futures trade, a crypto trade and a skipped trade, plus a worked ten-trade review. Every number is fictional and labelled. Copy the structure, not the numbers, and download the matching free template. Updated 18 October 2026.
By Harrison Weaver, founder of The Trading Terminal
What does a filled-in trading journal look like?
These trading journal examples show real structure with invented numbers. Each is a fictional trade, labelled as such, so you can copy the fields and replace the values. Amounts are in an unnamed account currency and nothing here is a recommendation or financial advice.
Example 1: a day trade (index, New York session)
| Field | Entry |
|---|---|
| Date, instrument, direction | 6 Jan 2026, NAS100, long |
| Session and setup | New York, Breakout |
| Entry, stop, target, exit | 17,420 / 17,400 / 17,470 / 17,462 |
| Risk and result | Risk $100, net $210, +2.1R |
| Followed the plan? | Yes |
| Emotion / discipline | 4 of 5 / 5 of 5 |
| Note | Waited for the retest of the opening range. No stop changes. Out before the target because momentum faded, which was in the plan. |
Template: day trading journal template.
Example 2: a swing trade (forex pair, multi-day)
| Field | Entry |
|---|---|
| Dates, instrument, direction | In 6 Jan 2026, out 13 Jan 2026, AUD/USD, long |
| Setup and weekly trend | Pullback, weekly trend up |
| Entry, stop, target, exit | 0.6600 / 0.6540 / 0.6750 / 0.6680 |
| Risk and result | Risk $200, net $266.67, +1.33R, 7 days held |
| Catalyst | Rate decision the previous week |
| Note | Held through a quiet Asian session as planned. Sold at the first resistance rather than waiting for the target, a deviation I want to count. |
Template: swing trading journal template.
Example 3: a losing trade with a mistake tag
| Field | Entry |
|---|---|
| Date, instrument, direction | 8 Jan 2026, EUR/USD, short |
| Session and setup | London, Reversal |
| Result | -1R (stop hit) |
| Mistake tag | No Confirmation |
| Followed the plan? | No |
| Emotion / discipline | 2 of 5 / 2 of 5 |
| Note | Entered on the first rejection candle. My rule needs a close back inside the range. Grade D for execution, even though the idea was reasonable. |
The tag is what makes this useful: it will be counted with every other trade that skipped the confirmation.
Example 4: a futures trade (contracts and ticks)
| Field | Entry |
|---|---|
| Date, contract, direction | 6 Jan 2026, ES, long, 2 contracts |
| Entry, stop, exit | 5,000 / 4,996 / 5,006 |
| Ticks | 24 ticks in favour (tick size 0.25) |
| Money | Gross $600 (24 x $12.50 x 2), costs $4.60, net $595.40 |
| Risk and result | Risk $400 (16 ticks x $12.50 x 2), +1.49R |
| Note | Took half off at 1R, moved to breakeven as planned. |
Template: futures trading journal template.
Example 5: a crypto trade (fees matter)
| Field | Entry |
|---|---|
| Date, pair, market | 6 Jan 2026, BTC/USDT, spot, long |
| Entry, stop, target, exit | 95,000 / 93,500 / 99,000 / 97,000 |
| Size and money | 0.1 BTC, gross $200, fees $9.50, net $190.50 |
| Risk and result | Risk $150, +1.27R |
| Note | Fees took close to 5% of the gross gain. Worth watching when targets are small. |
Template: crypto trading journal template.
Example 6: a skipped trade and a no-trade day
| Field | Entry |
|---|---|
| Skipped trade | 7 Jan 2026, GBP/USD. Setup appeared but spread was wide and it was inside the news window. Skipped by rule. |
| What happened next | Price reached the target. Not a mistake: the rule was clear, and I will count it as skipped by rule. |
| No-trade day | 9 Jan 2026. No setup in my session. Tired, slept badly. Chose not to trade. One line on the market: range-bound. |
Skipped and no-trade entries keep the habit and show whether your filters help.
How do you review ten journal entries?
Here is a worked review of ten fictional trades, every figure calculated from the list. Risk was $100 on each trade.
| # | Setup | Net P&L | Result | Mistake tag |
|---|---|---|---|---|
| 1 | Pullback | $150 | +1.5R | — |
| 2 | Breakout | -$100 | -1R | Early Entry |
| 3 | Pullback | $210 | +2.1R | — |
| 4 | Breakout | -$100 | -1R | Chased Entry |
| 5 | Pullback | $95 | +0.95R | Premature Exit |
| 6 | Reversal | $0 | 0R | — |
| 7 | Breakout | -$100 | -1R | Moved SL |
| 8 | Pullback | $180 | +1.8R | — |
| 9 | Reversal | -$100 | -1R | No Confirmation |
| 10 | Pullback | $160 | +1.6R | — |
| Measure | Working | Result |
|---|---|---|
| Trades | 5 wins, 4 losses, 1 break-even | 10 |
| Win rate | 5 wins / 10 trades | 50% |
| Average win | $795 / 5 | $159 |
| Average loss | -$400 / 4 | -$100 |
| Expectancy per trade | 50% x $159 - 40% x $100 | $39.50 |
| Profit factor | $795 / $400 | 1.99 |
| Total net P&L | Sum of all ten | $395 |
| Average result in R | $395 / 10 trades / $100 risk | +0.4R |
The win rate is only 50%, yet expectancy is positive because the average win is larger than the average loss. That is the point of tracking both. The definitions match the how we calculate page.
By setup
| Setup | Trades | Wins | Win rate | Net P&L |
|---|---|---|---|---|
| Pullback | 5 | 5 | 100% | $795 |
| Breakout | 3 | 0 | 0% | -$300 |
| Reversal | 2 | 0 | 0% | -$100 |
By mistake tag
| Mistake tag | Trades | Net P&L of tagged trades |
|---|---|---|
| Early Entry | 1 | -$100 |
| Chased Entry | 1 | -$100 |
| Premature Exit | 1 | $95 |
| Moved SL | 1 | -$100 |
| No Confirmation | 1 | -$100 |
The 5 tagged trades add up to -$305, while the 5 untagged trades add up to $700. That comparison is the idea behind Mistake Cost Analysis: it adds up the net P&L of the trades carrying each tag, and does not estimate what they would have made without the mistake. Ten trades prove nothing; the sample shows the method.
What makes a trading journal example worth copying?
- It records the reason and the rules, not only the result.
- It uses a fixed list of setup and mistake names, so entries can be counted.
- It stores risk, so results can be expressed in R and compared.
- It includes losing, skipped and no-trade entries.
- It takes a few minutes. If an entry takes longer, trim the fields.
For the prompts behind each field see what to write in a trading journal. To log these in a spreadsheet use the trading journal template, or start in the app with the free trading journal plan.